2 Computer Requirements and Installation of MSiReader
2.1 Minimum Computer Requirements
MSiReader v3.12 was developed and extensively tested on a WIN 10 and WIN 11 64-bit operating systems. It is highly recommended to have at least 32 GB of RAM but ≥ 64 GB is preferred. We are working on a version of MSiReader that is fully tested on Mac computers.
2.2 Installation and Start-Up
For a video tutorial on how to properly install MSiReader, click HERE.
Figure 1: Display after 15-day free trial is selected. The SKU is Trial and the Category is Professional License since all functionality is provided for the trial period. At the end of the trial period, the license automatically expires.
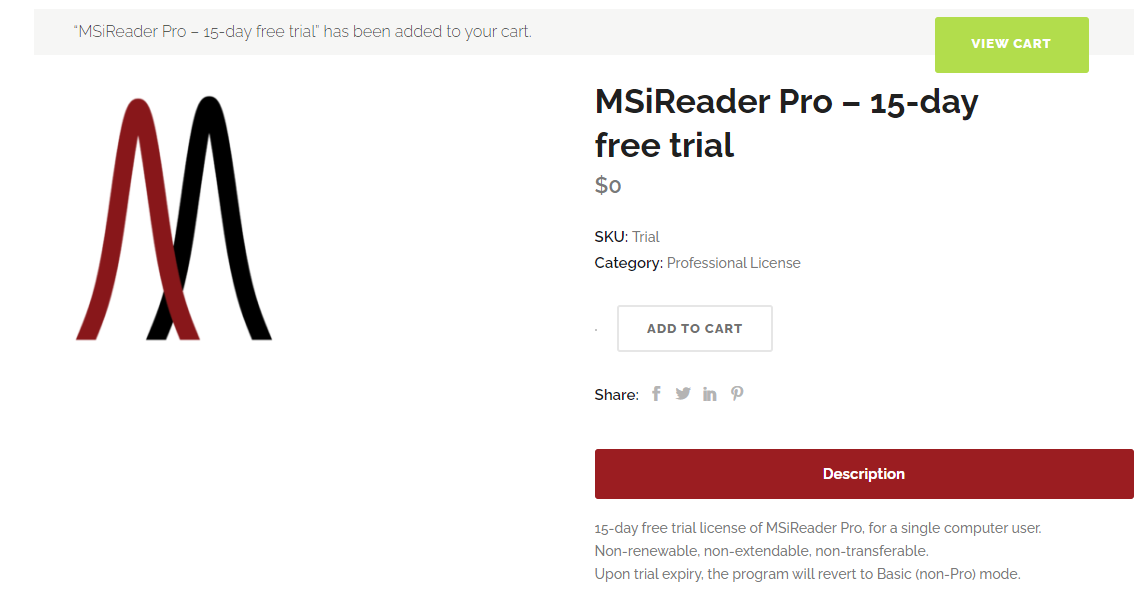 To begin the installation process, go to https://msireader.com/compare-plans and scroll down the page to see the 15-day free trial, Professional or BioPharma version. Click the Download button which will then add that product to your cart (15-day free trial will indicate $0 and Professional License since all functions will work during a trial period). Figure 1 shows what is displayed.
Click the Green Button “View Cart” and verify details on the new page that is displayed. Next, click “Proceed to Checkout” which will require the end-user to enter in a valid name, address and email. The end-user will also have to agree to website terms and conditions. Next click “Place Order”. This will provide you with details about your license, when it expires, etc.
If you are beyond the trial period and are purchasing a license (paid subscription for Pro or BioPharma mode), the process is the same except you will need to choose the product and term that you wish to purchase and add each item after adjusting the quantity to your cart. When you Proceed to Checkout, there will now be a place to pay by credit card, direct wire transfer or pay by check.
In either case outlined above, once you land on the checkout page, look under the downloads section and click on Program Installer which will download the MSiReader installer to your local hard drive. The installer automatically downloads and installs the Matlab Compiler Runtime engine (MCR, approximately 3 GB); this could take ~10 minutes depending on your computer and network speed. This MCR installation is a one-time download because it will rarely need updating. Future installations and upgrades of new MSiReader versions will be much faster and is done by simply clicking “Update this program” under the Home menu.
Double click the MSiReader_install.exe file. A popup box will appear and ask if you allow this program to make changes to your device. MSiReader is a verified publisher from MSI Software Solutions, LLC as noted. Then select Yes and then Next and Next once again. The installer GUI will indicate that the installation is complete – please close this GUI.
IMPORTANT: Install the program in a folder of your choosing but DO NOT choose a location that is not local (e.g., DropBox) and DO NOT place under the WinOS Programs Folder. The installer will default to creating a MSiReader folder and install the program in that directory. We highly recommend following this suggestion.
After you install the software, go to the folder which contains the program files. Double click on the post-install.bat file to complete the installation process. Once it is complete, this file will be removed from this folder.
After you install the software, go to the folder which contains the program files. Select the MSiReader.exe application file and right click and then select “show more options” and then select “pin to taskbar”. Start the program by clicking once on the ICON that is now in your taskbar. You can also pin the app to the taskbar from the start menu in Win11.
When running the program for the first time, the MCR loads in the background, which can take up to a full minute without any visual feedback so please be patient and don't try to double-click the executable again. All console output of the program is sent to an MSiReader.log file (one log file is created each day) so any errors/messages will automatically be recorded. Subsequent launches of MSiReader will be much faster since the MCR has been initialized.
The end-user can edit the MSiReaderPrefs.INI file which allows the end-user to customize the user interface; default settings are provided in the MSiReaderPrefs.INI file. See §5 of the user manual for details.
Minimally, you will probably want to change the default Pathname for file Open and Save dialogs. Again, DO NOT choose a location that is not local (such as a networked or server location) as this will significantly decrease the performance of MSiReader.
A folder of data files that are used in this manual can be found on our website (www.msireader.com/support). This folder is called MSiReader Test Data and contains 18 subfolders for different functions in MSiReader. In each subfolder, a file called README.txt is present and contains specific information that you will help you get started with that specific dataset.
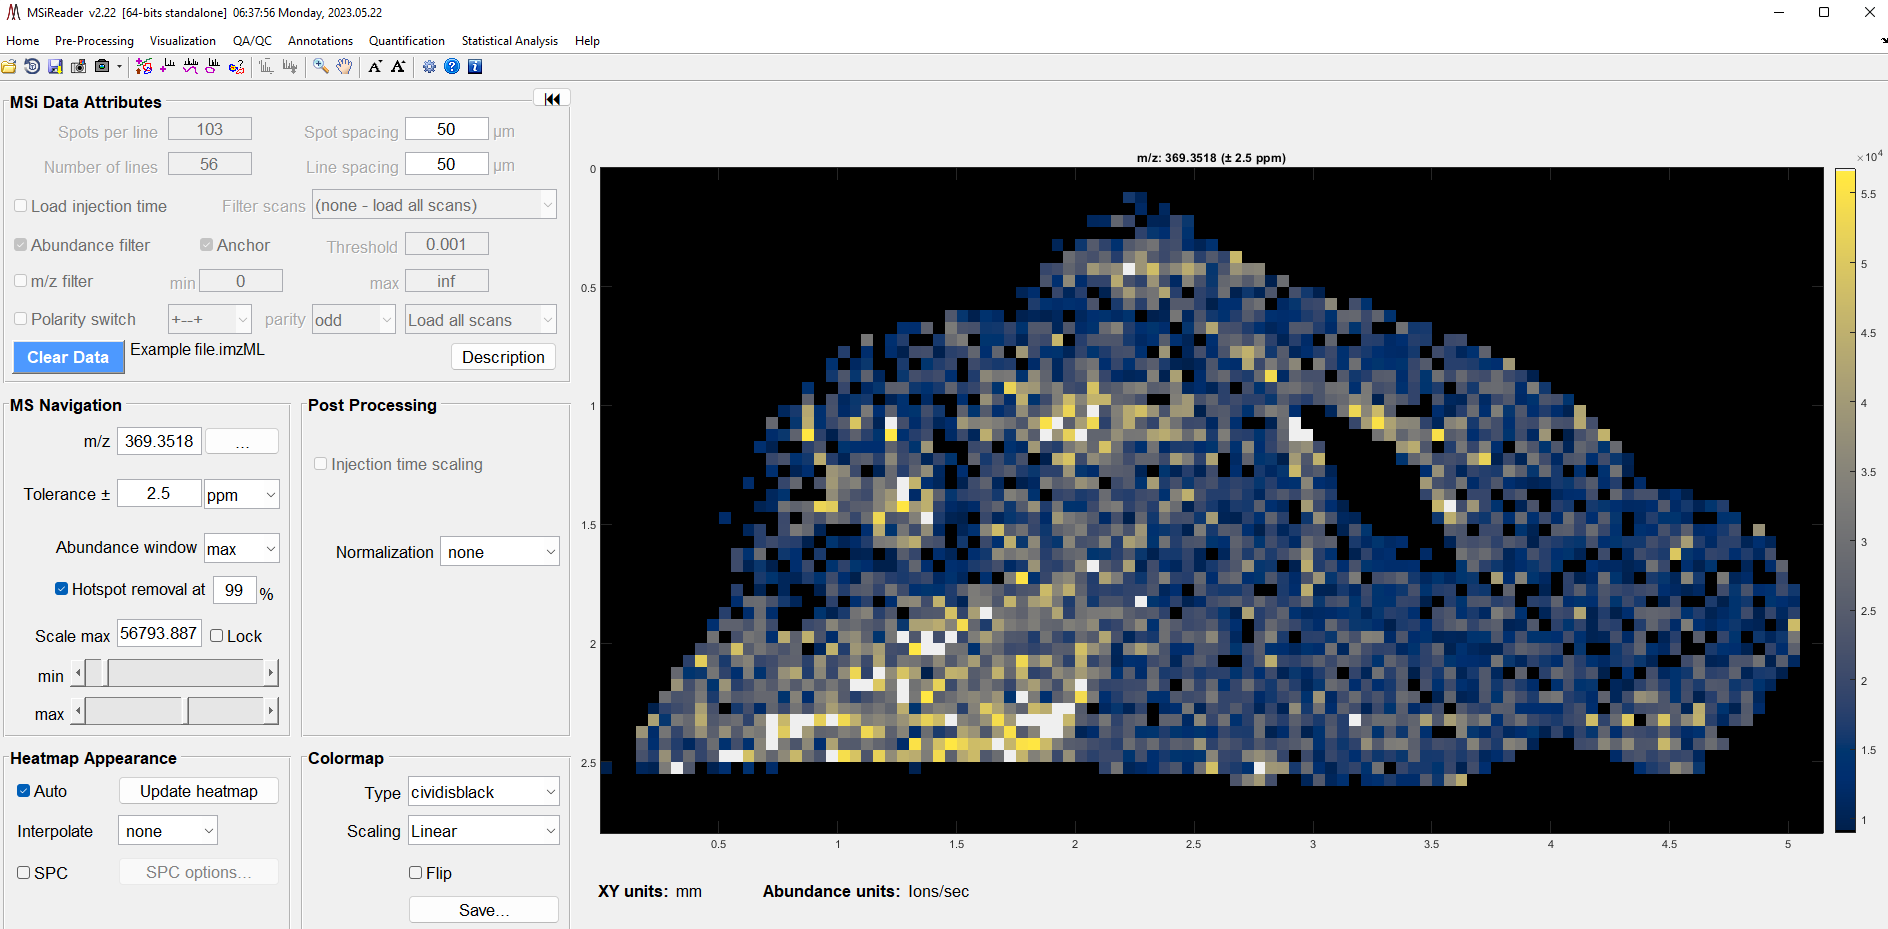
Figure 2: Loading of test data “Example.imzML” upon installation of MSiReader.
2.3 Status Bar and STOP Button
The MSiReader v3.12 main GUI includes a status bar for reporting the progress of loading datasets and a STOP button for early termination on the lower middle. Figure 3 shows the MSiReader status bar updating while a file is being loaded. The status bar is always from 0% to 100% with a text overlay in the center which provides further information about the current operation. In this example, spectrum 6796 out of 17632 spectra in this data set have been being loaded. Note that for HTS/HCS experiments from well-plate data, file loading is near instantaneous and thus, the end user will likely only see the status/progress bar flash on the screen and then disappear.

Figure 3: Status/progress bar when loading data into MSiReader.
Clicking the STOP button will launch a confirmation dialog box as shown in Figure 4. In this case, the user can cancel loading the data file or continue.
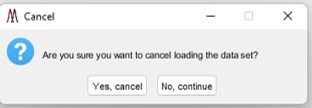
Figure 4: After clicking the red STOP button when loading data (see Figure 3) the user will be prompted with the dialog box shown here. The user can either select Yes to Cancel loading the data or No to continue loading the data.
2.4 Processing Data with MSiReader and Suggestions for Reducing File Sizes
Note: The following sections are directly related to the MSI Mode of MSiReader as HTS/HCS file sizes are typically very small; thus, to date, the BioPharma Mode has not experienced any issues with exceeding available RAM.
Predicting the maximum size data set MSiReader can process is not trivial since it depends on the amount of available RAM, which depends on the number of applications running on the computer. There needs to be enough RAM to store the data set, and sufficient memory left for additional processing operations. Some of these may require the creation and temporary storage of large variables. An example memory usage calculation follows.
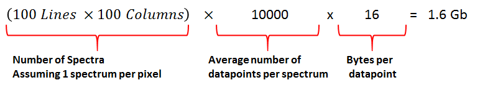
Figure 5: Basic calculation of total file size based on ROI, number of datapoints per spectrum and bytes per datapoint.
Using a Windows 11 Pro computer with 32 GB of RAM, MATLAB R2022a consumes about 700 MB. Windows OS uses about 2 GB and MSiReader requires approximately 150 MB before a data set is loaded. Thus, it follows that ~29 GB is therefore available to MSiReader for loading, storing and analyzing MSI data. A single data point in a scan (m/z value and abundance) requires 16 bytes of memory, so for example, if a region of interest (ROI) of 100 lines and 100 columns is scanned and each generated spectrum contains an average of 10,000 m/z data points, the memory requirement can be calculated as shown in Figure 5.
MSi PeakFinder (§7.7.1) over a large ROI (e.g., 2500 scans) uses about 1 additional GB. Total memory used is then 2.6 GB. With 29 GB of RAM available to MSiReader, a data set approximately 10 times as large as this example can be processed. It is common for MSiReader to work with files that contain more than 10,000 spectra and where the number of data points varies from 20,000 to 100,000 for each scan (processed raw files converted to imzML format). For example, the file used to demonstrate the MSi Quantification tool (§7.7.2) contains 7426 scans and almost 250M non-zero data points. The total amount of memory used by Windows, MATLAB, and MSiReader after loading this data set is 7.1 GB. Note that a desktop PC with 32 GB of RAM may be purchased for less than $1000. We highly recommend purchasing a desktop PC with at least 64 GB of RAM with the ability to add more in case your applications evolve and processing of larger and/or multiple files is demanded.
This example also highlights the advantage of using processed data where zero abundance data values have been eliminated. See the discussion about imzML files in §3.1. 10,000 data points/spectrum corresponds to an m/z data step size of 0.1 Th (Thompson units) over an m/z range of 1000 Th in the case of continuous (evenly spaced) data points on the m/z scale. If data is processed and zeros have been eliminated, 10-6 Th step sizes can be stored with 10,000 data points/spectrum over the same m/z range.
In case the data file is too large to be handled by your computer, here are some potential solutions:
2.4.1 File Conversion
Use a converter like the MSConvert tool from Proteowizard5,6 to convert your original instrument raw file or another file sharing format (mzXML, mzML) into multiple files with smaller m/z ranges (e.g., instead of having one single file for 200-2000 m/z, have 4 files covering 450 m/z each). Also see §2.4.1 for more information about file conversion. Although this approach will not allow visualizing all the data at once, it will not impact the mass resolution of each image file.
2.4.2 m/z range filter
Use the m/z range filter to reduce the spectrum saved for each scan as it’s read into MSiReader’s internal data set storage. See §6.2.1 for how to use the m/z range filter. This only applies to the MSI mode.
2.4.3 ROI location file
A region of interest (ROI) location file can be used to read a portion of a large file. See §3.1 and §6.2.1 for details. Note that this is more effective for reducing RAM requirements for imzML files than for mzXML files; therefore, it is advantageous to convert your files to imzML format.
2.4.4 Abundance threshold filter
Use the abundance threshold filter to reduce the number of low abundance peaks that are saved when the file is being loaded. Files from some instrument vendors may contain an extremely large number of zeros or nearly zero abundances (up to 95% of the total data points!). The abundance filter should always be used with an appropriate threshold to eliminate these zero values. In the MSi Data Attributes (MSI mode) or the Plate Attributes pane (BioPharma Mode), BEFORE you load your file, check the box for Abundance Filter and then enter in a value that is appropriate for your data in the Threshold Box as shown in Figure 6 for the MSI Mode.
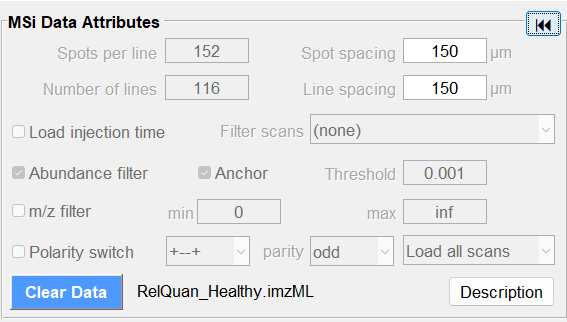
Figure 6: Thresholding data can be done to avoid loading zeros (or nearly zero values) in your dataset to reduce RAM requirements and improve data analysis performance in MSiReader.
Checking “Anchor” within the MSI Data Attributes (or Plate Attributes Pane) dialog box causes consecutive runs of abundance values below the filter threshold to be replaced by two zero values, one at each end of the m/z range being filtered out, instead of being eliminated. This forces spectral line plots to be “anchored” to the m/z axis between peaks. However, note that using this filter increases loading time for most data sets.
The option to anchor filtered peaks to the baseline is unnecessary when loading centroid data sets. To improve performance, this option is ignored if any of the scans have been centroided. This only applies to imzML data files and can be disabled by setting the preferences INI file variable, NoFilteredPeakAnchorCentroid, to false (§5).
With all file formats except *.mss, the mass spectra may contain many very low abundance data points. These m/z (x) abundance (y) pairs can be filtered out of the data as the file is loaded to conserve memory space and to enhance performance. The threshold value is the smallest abundance value that is retained for any data pair in a scan. The default value is 0.001 and this can be changed with the MinAbundanceThreshold value in the preferences INI file (§5). You can change it to any value between zero and 1e6. Threshold filtering is most effective for continuous data (IMG format), imzML files and native *.raw files. Due to the structure of the parser, it is less useful at reducing memory usage for mzXML files; however, after a data set is loaded, processing and heatmap updates will be faster.
2.4.5 Centroiding Data
Centroid your data during conversion to imzML files or collect your data natively in centroid mode.7 These are mentioned here as alternatives to collecting your data natively or carrying this out during file conversion using second party algorithms.
During conversion of your profile data, you can significantly reduce the file size by centroiding your data during conversion. Alternatively, you could collect your MSI data in centroid mode on your mass spectrometry imaging platform. In either case, MSI Software Solutions highly recommends that you carefully check either route to make sure that this does not “compromise” your data in a way that is unacceptable to you. For example, collect datasets natively in both profile and centroid mode on the same sample and then check to make sure that they provide you with the same results including such attributes as mass measurement accuracy, spectral accuracy, # of annotations.7 These are your best options to reduce file size and maximize performance of MSiReader for any given computer configuration.
As an example, a dataset was collected using the same ROI area in both profile mode and then in centroid mode on a MSI platform. The physical memory in the laptop was 32 GB of which 25 GB was available before opening up MSiReader; opening MSiReader reduced the RAM available to 24 GB. Importantly, loading the profile data (*.ibd file ~ 3 GB) and the natively collected centroided data (*.ibd file ~ 250 MB), the amount of available RAM increased from 20 GB (profile) to 23 GB (centroid) as expected. Conversely, for HTS/HCS 384 well-plate data, the file size is < 100 MB.
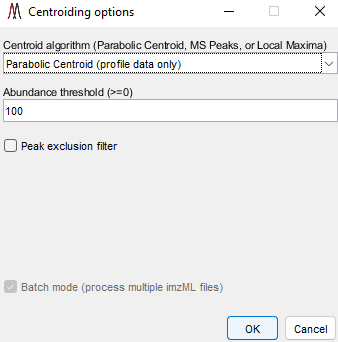
Figure 7: Centroid Data Options Panel in MSiReader
MSiReader can take your profile data and centroid it for you – this will reduce the file size and therefore reduce the amount of RAM required. This feature was added to enable some tools to be used in MSiReader that require centroided data but can also be used to reduce file size to the data in memory or using the batch mode. Under the Main Menu item “Pre-Processing” select “Centroid Data” function as shown in Figure 7. You can select from three different centroid algorithms (if you are using this tool on data that is already centroided, you must choose “Local Maximum” as the Centroid algorithm), set an abundance threshold, turn on or off the peak exclusion filter (peak exclusion must be carried out on centroided data – in this case, it will centroid your data and then apply the exclusion filter) and set your peak tolerance in this panel. Then select OK. If you check the peak exclusion filter, you will be prompted for a list of m/z values (.txt file). If the clipboard contains a positive number within the m/z range of the loaded data set you will be asked if you want to use those values as the exclusion list. If it contains other content or you decline you will be prompted to select a .txt or .xlsx file with the m/z values that you wish to exclude. In the case of selecting a .xlsx file with more than one worksheet you will be prompted to select a specific worksheet. For both file types, the first column of values will be used.
The exclusion list could be background ions that are present in high abundance in every spectrum that will be removed from the spectra and heatmap or a series of MALDI matrix peaks for MSI data files. In MSI Mode, this could also be a list of peaks that were determined to be background ions versus on tissue. In BioPharma Mode, this exclusion list could be excess drug as one example that a user would like to remove prior to using MSiExport and use of multivariate analysis. If you set peak exclusion as “false” (by not having the check box checked), it will centroid your data using the other parameters you have selected in the options panel (Figure 7).
Upon centroiding your data in memory, you will be prompted to save a new imzML file in the same folder – MSiReader will add the extension _centroided to the original filename but the user can enter in any filename they choose prior to saving. For batch mode centroiding of data, it will aways add _centroided to each filename automatically and save them in the same folder as the original data.
IMPORTANT: Centroiding data may produce unexpected results if the input file is not an actual mass spectrum but a peak list (preprocessed centroid data). All data preprocessing steps (whether MSiReader or other software) should be validated in your workflow prior to applying them to your data to ensure artefacts are not introduced.
If you check Batch mode Figure 7 and then OK, a file explorer box will open and then you can chose a folder and then select one, several or all .imzML files that the user wants to centroid. This process is carried out in the background. As an example, the .ibd file size for the profile data (in Mass Correction Folder) was ~1.2 GB but after the centroid algorithm was applied, the file size dropped to ~89 MB.
You can simultaneously do abundance thresholding which will further reduce the RAM required (§2.4.4). Moreover, prior to (or after using Scan scrubber tool) centroiding your entire dataset that has been loaded, you can use the ROI selection icon for a polygon and after you select the data of interest, then go to Pre-Processing and then Centroid Data and it will prompt you to select “ROI Scans” or “All Scans”. Once you draw your polygon for the data of interest, if you want the polygon to be a square, right click on the heatmap and select “Make ROI a Rectangle”. You can click on the square and move it around to position it over the ROI of your choice.
There are 3 options to centroiding as shown in Figure 8 which include Local Maxima, Parabolic Centroid and MS Peaks (wavelet transform – not shown). Only use Local Maxima for data that was previously centroided data in the case where you wish to apply a threshold and/or peak exclusion filter. This is recommended because Local Maximum, when applied to profile data using most software, will likely compromise your mass measurement accuracy and ion abundance. This is of course the fastest of the three centroiding algorithm; however, be cautious centroiding data using this approach.

Figure 8: Illustration of centroid algorithms / calculations showing local maximum and parabolic functions.
MS Peaks uses a wavelet transform and filter to find peaks and is similar to the CWT algorithm for peak picking in MSConvert5. This algorithm finds peaks in a noisy signal by smoothing the data using a wavelet transform (Daubechies filter banks), putative peak locations are determined and then post-filtering to reduce over segmented and noisy peaks. This approach to centroiding will likely increase computational time significantly.
Important Note: Once the user has centroided their data in MSiReader, the modified imzML file can only be read by MSiReader due to our proprietary parsing algorithm and padding to reduce file size. Regardless, the .ibh, .imzML and .ibd files must all be present to open the file for analysis.
2.4.6 MSiReader imzML Parsing Tool
Use the MSiReader imzML parsing tool. Load each of the imzML files for your project into MSiReader and then clear them and then re-load them. The first time you load an imzML file into MSiReader, it makes use of our own parsing tool to retrieve necessary metadata for MSiReader from the file. During this process MSiReader will create an .ibh file. The second and all subsequent times you load the imzML for a given dataset, MSiReader looks for the .ibh file and the .ibd (mass spectrometry binary data file) and loads those files. Please do retain the imzML file in the same folder. This process is done automatically, and you will notice when you load the same datafile, that load times will be significantly faster. For example, the mouse bladder MSI data shown on the front cover of the user manual, the imzML file is 55 MB while the .ibh file is only 500 kB. Note: this is done automatically for all imzML datasets loaded into MSiReader. If you don’t want to use our parsing tool, set the preferences file variable UseFastimzMLFileLoader to false and reload preferences or restart MSiReader (§5). No .ibh file will be created and file loading will be slower. Please report any errors to the developers by sending a screen capture of the error dialog and/or the MSiReader log file (in application folder, logs subfolder) to support@msireader.com. You can also validate the format of your imzML file using the imzMLValidator tool. This tool may be able to identify and correct an error in the file due to errors in the conversion process.