Part II: User Guide - Basic Functions
6 Basic Functions and Tools in MSiReader
There are a number of basic functions and tools in MSiReader that are commonly used by the MSI community; these include loading single, multiple or a folder of files, abundance threshold filtering, injection time scaling, single pixel selection tool with view and export mass spectrum, customizable user preferences, and export of high quality heatmaps for publication in different file formats. These functions are highly integrated into the main GUI along with functions that are useful for the MSI Mode and the BioPharma mode.
6.1 The Home Menu
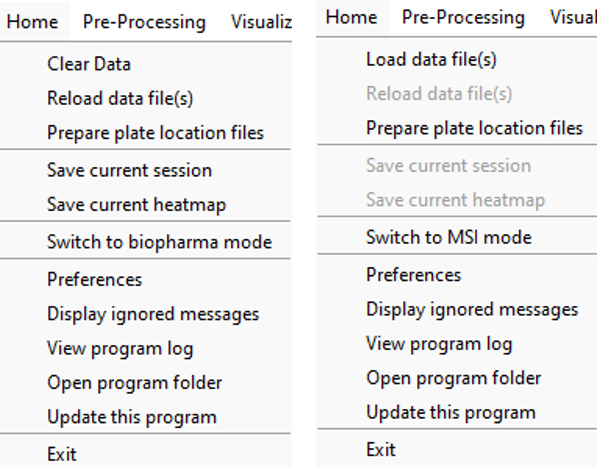
Figure 25: A screenshot of the twelve different functions a user can carry out from the Home menu which include: 1) Clear Data (left) …Load Data (right) (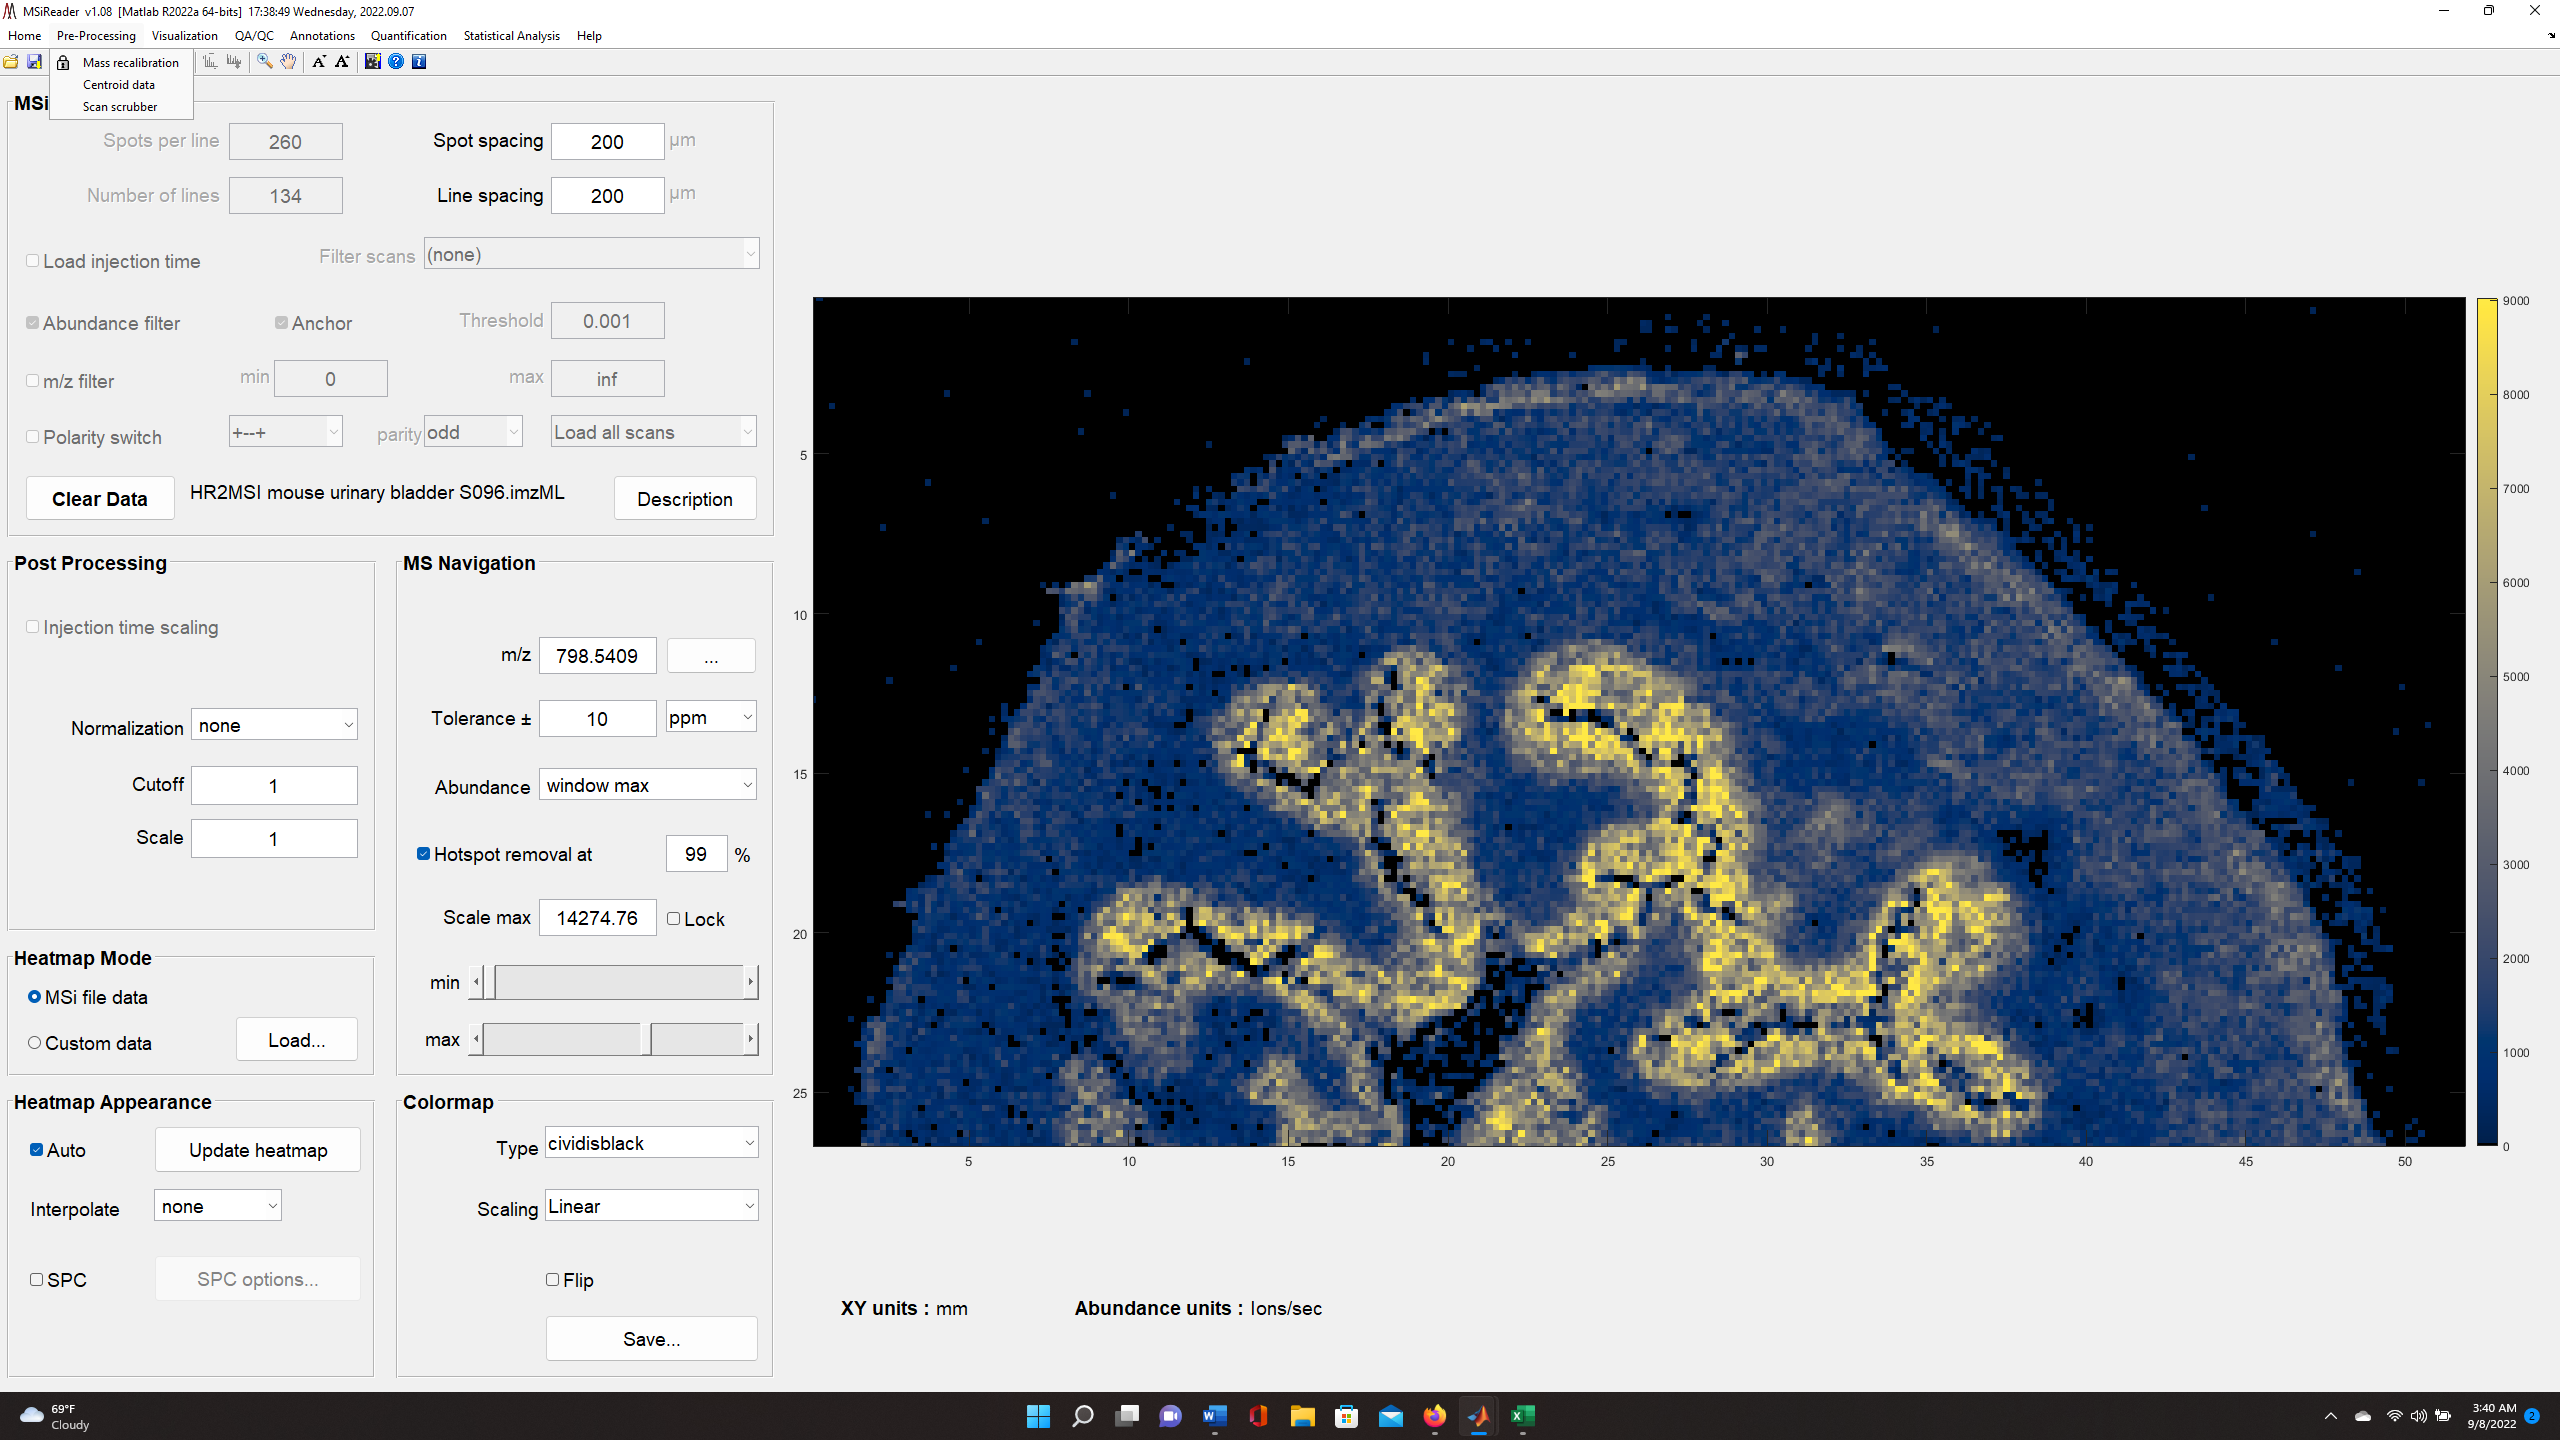 ); 2) Reload MSI data (
 ); 3) Prepare plate locations (only for Biopharma mode); 4) Save current session as a *.mss file (); 5) Save current heatmap (
 ); 6) Switch to BioPharma mode …. Switch to MSI mode; 7) Preferences (
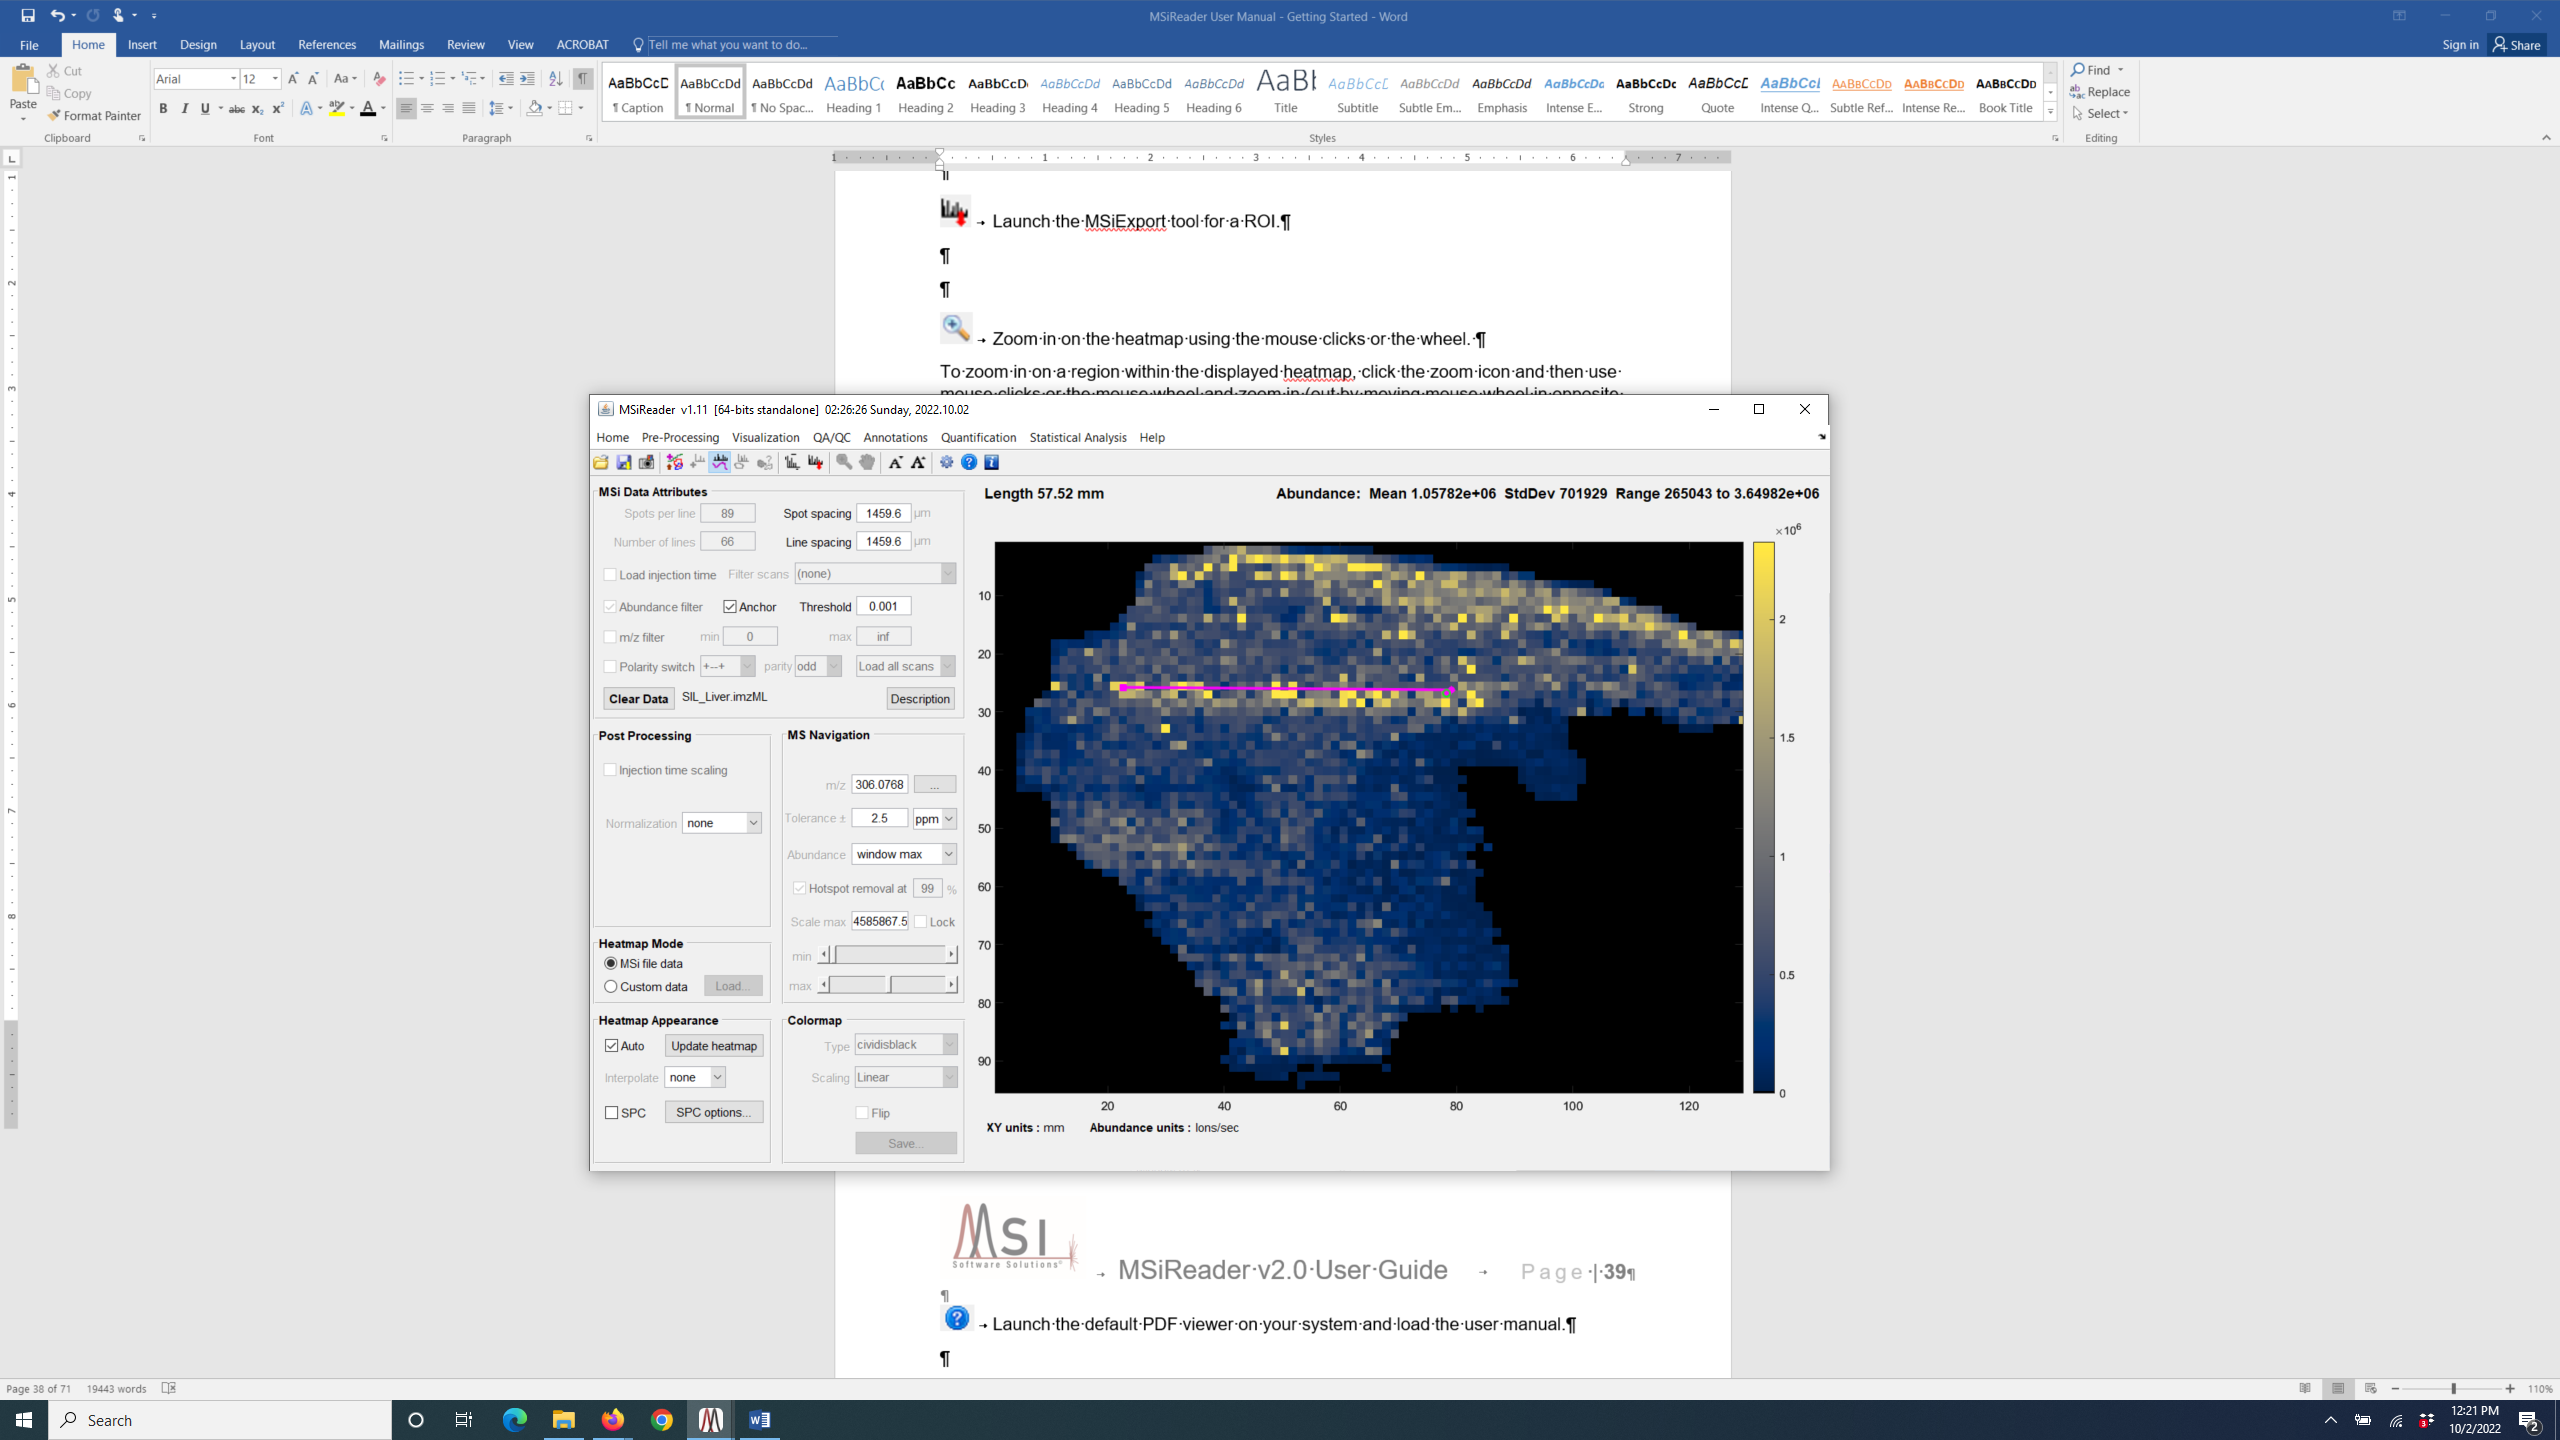 ); 8) Display ignored messages. If a user checks a box “don’t show me this message again”, they can choose to display these messages here. 9) View program log (useful for troubleshooting errors with support team at MSI Software Solutions); 10) Open program folder; 11) Update this program – when new releases are available, simply chose this option to update your program. 12) Exit (no icon but the x in top right corner carries out the same function).
The Home pull down menu has 9 options to choose from, 5 of which are also have an ICON to carry out the same function as shown in Figure 25. When you choose “load data”, you will be prompted to a pull-down menu with several options for filetypes. After your data is loaded, the menu item and the “LOAD” button in MSi Data attributes will change to “CLEAR”.
“Save current session” (*.mss file format) not only saves all your data but also the precise tools and settings you were using when working up your data. When you choose “Save current heatmap” you will have 14 different file formats to choose from in the pull-down menu. This will generate the current heatmap into a new figure that you can customize. Using the menu in the pop-up GUI, you can change font type and size, change the title (default is the m/z value and m/z tolerance that was used to generate the heatmap), axes labels, etc. Once you make your edits to your figure, using the pull-down menu, the end user can save the graphic in several different file formats.
The “Preferences” opens up a dialog box as discussed in §5 which allows a user to customize MSiReader with default values that pertain to your research projects. Using the items in the Home menu (or their respective ICONS when available) in conjunction with the main GUI of MSiReader, a user can efficiently explore their dataset and begin the process of discovery, generate figures for documenting findings in notebooks or for publications, and save your session (*.mss) for re-visiting at a later date with precisely the same parameters when you exited MSiReader.
6.2 The MSiReader Main Graphical User Interface (GUI) for MSI Mode
A video tutorial on navigating the main GUI of MSiReader for MSI mode can be found HERE. Note this is an overview of the entire GUI for MSI mode.
The main GUI in MSiReader MSI Mode contains 6 panes and includes: 1) MSi Data Attributes; 2) Post-Processing; 3) MS Navigation; 4) Heatmap Mode; 5) Heatmap Appearance; and 6) Colormap. Collectively, these serve as a simple and effective interface to efficiently begin to look at your MSI data with a large heatmap display on the right. Below, each of these panes will be discussed. Please note that when you load MSiReader for a given session, only the MSi Data Attributes pane is shown until a data file is loaded. The overarching GUI with menus, sub-menus, and context menus were discussed in §4 and the description and function of the MSiReaderPrefs.INI were presented in §5. In this section, details will be provided to guide you through the process.
Recall that you should adjust your font sizes to match your display resolution as described in §4.2 using the “A” ICONS in the taskbar for an improved user experience. This can also be done by clicking on the “Visualization” tab and going down and clicking on “Increase font size” or “Decrease font size” repeatedly until the GUI is appropriated sized for your display. You can also set this in the preferences .INI file (§5) default value = 9.
6.2.1 MSi Data Attributes Pane
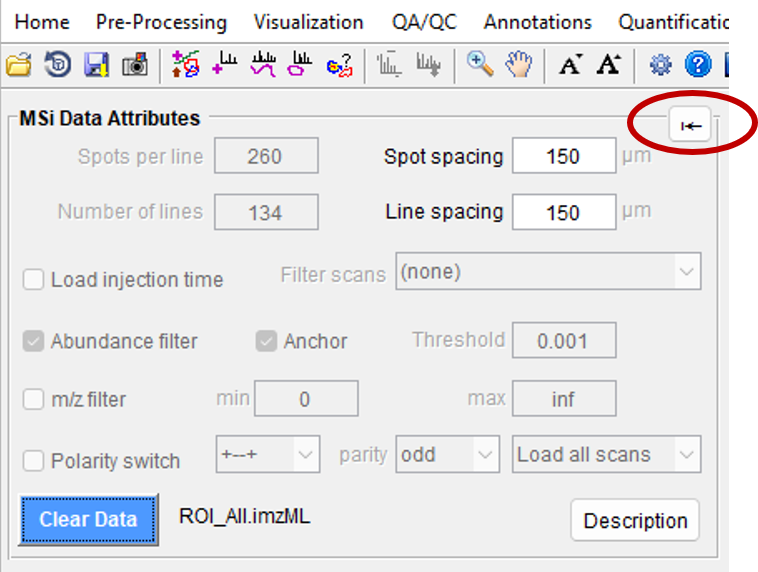
Figure 26: The MSi Data Attributes pane displays the choices that you have set as a default in the MSiReaderPrefs.INI file as well as some values that were imported from the imzML file.
Figure 26 shows the MSi Data Attributes Pane; when you first load MSiReader for a session, this is the only pane that is displayed until a file is loaded. However, prior to loading a specific data set, you can still make changes to these default checkboxes and values.
6.2.1.1 Characteristics of the MSI data
The spots per line, number of lines, spot spacing and line spacing are initially set to the default values in the MSiReaderPrefs.INI file (§5). Spots per Line and Number of Lines entries will be filled in automatically when you load a file unless the mzXML format (single file, multiple files or an entire folder) is selected. The Spot Spacing and Line Spacing fields, relating to the horizontal and vertical spacing, respectively, are loaded automatically from imzML and IMG format files and will affect the dimensions and aspect ratio of the heatmap plots. The Spot Spacing and Line Spacing fields can be changed at any time after the file has been loaded by typing new values into their edit boxes; these manually entered dimensions will be applied immediately. After the file is read, these values can also be modified to change the heatmap plot X and Y axis scaling and the aspect ratio. If set to a negative value the corresponding axis direction is reversed, that is, the heatmap is flipped left to right or turned upside down, respectively. If a value of zero is entered, one unit per pixel scaling is used. Default values can be given in the preferences .INI file in §5.
6.2.1.2 Injection time scaling
Heatmap abundance can be loaded and subsequently scaled by injection time with a checkbox in the MSi Data Attributes pane “Load injection time”. Injection times will either be read from the data file directly or, if not found in the file, the user will be prompted to enter a value during the load process. When the load injection time box is checked, the injection time is read into (or an injection time is manually entered in the dialog box). All of the scans in an image do not have to have the same injection time. For example, an imzML file that is a “stitched” composite of multiple data sets or a folder of imzML or mzXML files. How to use the injection time values will be discussed in §6.2.2.
6.2.1.3 Filtering data
Data sets can be filtered during loading in a number of ways including abundance threshold (§2.4.4).
6.2.2 Post Processing
6.2.2.1 Injection time scaling
If you loaded the injection time when you loaded your data file(s) or manually entered a value via the dialog box, in this pane there is a toggle to either use the injection time (checked) or not use the injection times (unchecked – default value). When using the injection time(s), the ion flux (ions/sec) is multiplied by the scan injection time and the heatmap is updated immediately as well as the abundance units. For example, changing from “ions/sec” (ion flux) to “ions” (total number of ions) if you go from not using ion injection time to using injection time information. If you then uncheck the box for injection time scaling, the abundance data is restored to its previous state by simply dividing by the injection time. The heatmap plot(s) is(are) immediately updated. The default labels (e.g., ions, ions/sec) can be changed in the MSiReaderPrefs.INI file (§5) to match the output of your specific mass spectrometry platform.
6.2.3 MS Navigation
The MS Navigation is shown in Figure 27 to navigate your data using different analytical figures of merit.
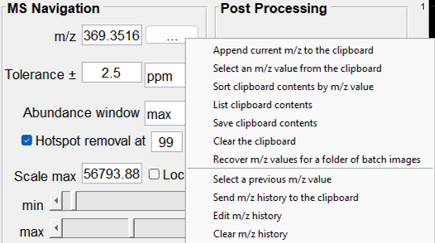
Figure 27: The MS Navigation Pane which includes data entry fields of m/z, tolerance, abundance determination, hotspot removal, scale max. scale lock and min and max slider bars to scale the heatmap. If you right click on the ”…” next to the m/z field, there is a context sensitive menu that provides options for moving m/z values to the clipboard as shown.
Once an image is loaded in MSiReader, the user can manually enter values in the m/z field. Below are descriptions of the options available in the MS Navigation pane.
6.2.3.1 m/z
Location on the m/z scale where the m/z window is centered. Note that it is possible to append m/z values to the clipboard by accessing the right-click context menu of the m/z edit box. A peak list can therefore be easily generated while navigating the data set and then used with the correlation and batch processing tools (§7.6.5) or pasted in Excel for later use. The right-click context menu for the m/z edit box (see Figure 28), contains items to access clipboard and history features that aid image navigation and make it easier to build lists of m/z values for batch processing and for saving in a document or spreadsheet.
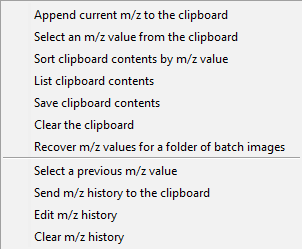
Figure 28: Context menu for clipboard and m/z history functions.
Whenever the heatmap plot is updated the m/z value is automatically added to the history. The clipboard is the windows system clipboard, so it is not necessarily empty when MSiReader is launched and anything added to it is available after exiting MSiReader. For example, the m/z values can be pasted into a column of an Excel worksheet while MSiReader is active or after exiting. Both the clipboard and the history are preserved when the loaded data set is cleared and new data is loaded. The m/z history is lost when the MSiReader session terminates.
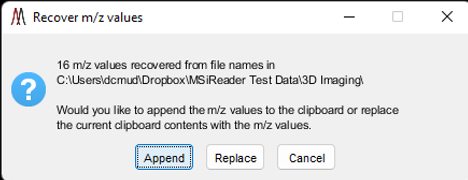
Figure 29: m/z recovery clipboard dialog.
Selecting the last item in the top section of the context menu, Recover m/z values for a folder of batch images, will prompt the user to select a folder and then attempt to build an m/z list from the names of the graphics files (bmp, emf, eps, jpg, pdf, png, tif, or fig) in the folder. For example, MSiReader’s correlation and batch processing tools (§7.6.5) and figure export (§7.6.6) tools create file names containing mmm_zzzzz.ext, where mmm.zzzzz is an m/z value and ext is one of the graphics file type extensions. This can be particularly useful when the contents of a folder have changed. For example, curating a folder of putative peaks with a viewing application. If any m/z values are recovered from the file names in the folder the user is prompted to either append them to the clipboard or replace the contents of the clipboard with the list as shown in Figure 29.
6.2.3.2 Tolerance
Size of the window considered for the calculation of the abundance of the m/z peaks. The user can choose to have a fixed m/z window in Thomson (Th) or a relative window in parts-per-million (ppm). Note that the m/z window size units selected will also be used by the MSiPeakfinder tool (§7.7.1).
6.2.3.3 Abundance
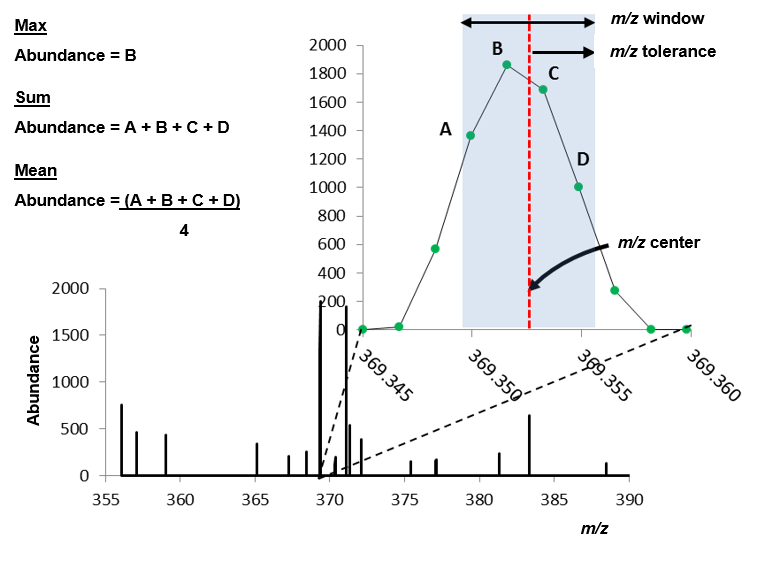
Figure 30: Definition of m/z window, m/z tolerance, m/z center and the three methods used by MSiReader to report ion abundance (max, sum, and mean).
MSiReader offers three different methods to map abundance to a color displayed on the heatmap: 1) the maximum abundance value in the m/z window (window max); 2) the sum of the abundance values in the m/z window (window sum); or 3) the mean of the abundance values in the m/z window (window sum). The meaning of these three options is shown in Figure 30. Note that the reported abundance and m/z value are not necessarily the values at the center of the window.
6.2.3.4 Hotspot Removal Tool
Described elsewhere in manual.
6.2.3.5 Min/max slider bars
Values for the minimum and the maximum abundance values represented by the color scale. All scans with an abundance outside of this range will be displayed with the most and least color intensities.
6.2.3.6 Scale Max
The default value for the abundance max slider bar is the maximum abundance of all the scans. For finer adjustment of the color abundance scale, simply change this value. There is also a Lock colorscale checkbox context menu item on the scale override field. This is useful for comparing images visually by forcing identical color bar scales regardless of the maximum abundance value. It applies to normalized data set in the MS Navigation pane as well as batch processing (§7.6.5).
Note: all default values can be modified in the preferences INI file (§5).
6.2.4 Heatmap Mode
Described elsewhere in manual.
6.2.5 Heatmap Appearance
Described elsewhere in manual.
6.2.6 Colormap
The default colormap is cividisblack which is color vision deficiency compliant3,4 and presents a heatmap that is representative of the data. It is a perceptually linear colormap instead of a “rainbow” style colormap like the previous default, jet, which has long been considered misleading for the presentation of scientific data3, especially when converted to grayscale and printed.
The scaling is a simple a way to better display large dynamic range data in the heatmap when you have an analyte that varies over orders of magnitude in abundance within your image. The user can choose from linear, log base 10, log base 2, and log base e. If you wish to “flip” which color is most abundant and which is least abundant, check the “flip” checkbox. Other colormaps are available as well.
6.3 Pre-Processing Menu
Note: Mass Correction, Centroid Data and Scan Scrubber are more advanced functions and are described in §7.3.
6.4 The Visualization Menu
Note: All the tools under this menu item including MSi Slicer, Image Overlay, RGB colocalization and 3D plotting are advanced functions and described in §7.4. Refer to respective sub-sections to learn more about those functions/tools.
6.4.1 Increase font size / Decrease font size
To increase the font size of MSiReader, you can use the icons “A” and “A” icons in the toolbar or access them through this drop-down menu. It will allow users to set MSiReader font sizes without having to do this through their global OS which will change all of their program displays.
6.5 QA/QC Menu
Note: Mass measurement accuracy, spectral accuracy and Auto MSI QC are advanced options and described in §7.5. Refer to respective sub-sections to learn more about those functions/tools.
6.6 The Annotations Menu
Note: Database, Molecular Formula Adduct Search, SSIM colocalization, MSi Spectrum (generate mass spectrum) and MSi Export (export abundance data) are advanced options in MSiReader Professional and BioPharma versions (§7.6). Refer to respective sub-sections to learn more about those functions/tools.
6.6.1 METASPACE Annotations
METASPACE Annotation Format. The MSiReaderPrefs.INI file contains variables that define the meaning of the columns in a METASPACE annotation file. This provides a means to accommodate future changes to the format and for the user to enhance the format with additional columns of information or create an entirely new format of annotation file. These variables are defined in Table 3.
Table 3: METASPACE variables in the MSiReader preferences INI file.
Variable | Default Value | Meaning |
MetaspaceHeaderRow | 3 | Row containing column heading character strings. |
MetaspaceFirstRow | 4 | The first row containing data values. |
MetaspaceMassSelectionColumns | 6 | Columns used to create the m/z pull-down menu. |
MetaspaceRankSelectionColumns | 4 5 6 7 8 9 10 11 | Columns used to create the Image order pull-down menu. |
MetaspaceMassSelectionDefault | 6 | Default m/z selection column. |
MetaspaceRankSelectionDefault | 6 | Default Image order selection column. |
MetaspaceMoleFormColumn | 4 | Column containing molecular formulas. |
MetaspaceAdductColumn | 5 | Column containing adduct names. |
After loading a METASPACE annotation file the Image order pull-down menu appears as shown in Figure 31. Note that an additional item, Sequence number, is always added to the end of the list. If it is selected the m/z values are not sorted and the images are assigned sequence numbers according to their order in the CSV file. Sequence number is also added to the menu when an Excel or text file is selected.
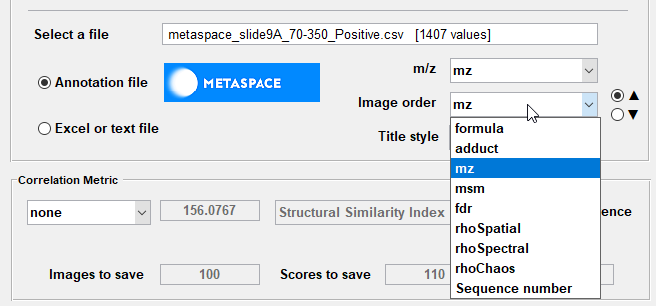
Figure 31: Image order selection for a METASPACE annotation file.
The right-click context menu for the Annotation file and Excel or text file radio buttons is used to clear loaded data so a new file can be selected as the m/z peak source as shown in Figure 32.
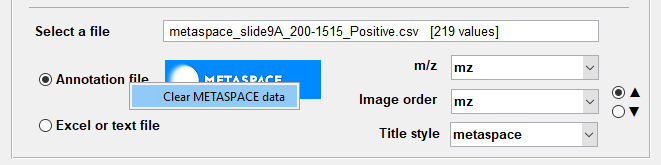
Figure 32: Clearing a loaded METASPACE annotation file.
6.6.2 ROI Functions
Select a single scan ROI using the cursor tool. Use this to select a single pixel (or voxel) in the heatmap. The user can drag this around using the mouse. Once a selected pixel of interest is decided upon, the user can right click and a sub-menu comes up allowing one to export the coordinates, change the color of the cursor, or plot the mass spectrum for the collected (or filtered) m/z range. When viewing the mass spectrum, there is a new toolbar at the top. These allow one to save the plot as a MATLAB .fig file, or print the spectrum. The next band of icons in the toolbar allows you to select a peak in the mass spectrum and update the heatmap for that specific m/z. You can also copy details to the clipboard for the selected peak. Finally, once a user selects a single pixel (voxel) and displays the mass spectrum, moving the cursor on the heatmap automatically updates the mass spectrum.
Other ROI functions are more advanced and described vide infra.
6.7 Quantification Menu
Note: Relative – MSi PeakFinder, Absolute – QMSI Spatial Calibration Curve, and fMSI PIE tool are advanced functions and described in §7.7. Refer to respective sub-sections to learn more about those functions/tools. Note: There is no quantification menu item for the BioPharma mode in MSiReader.
6.8 Statistical Analysis Menu
Note: PCA (§7.8.2) and t-SNE (§7.8.3) are advanced functions in MSiReader Professional version. Refer to respective section to learn more about this function.
6.9 The Help Menu
This section contains links to the following: 1) user manual; 2) end-user license agreement (EULA); 3) link to publications; 4) information about MSiReader; and 5) a link to contact us via email. The user manual can also be accessed by the icon  and information about MSiReader can also be accessed by the icon
  .
.