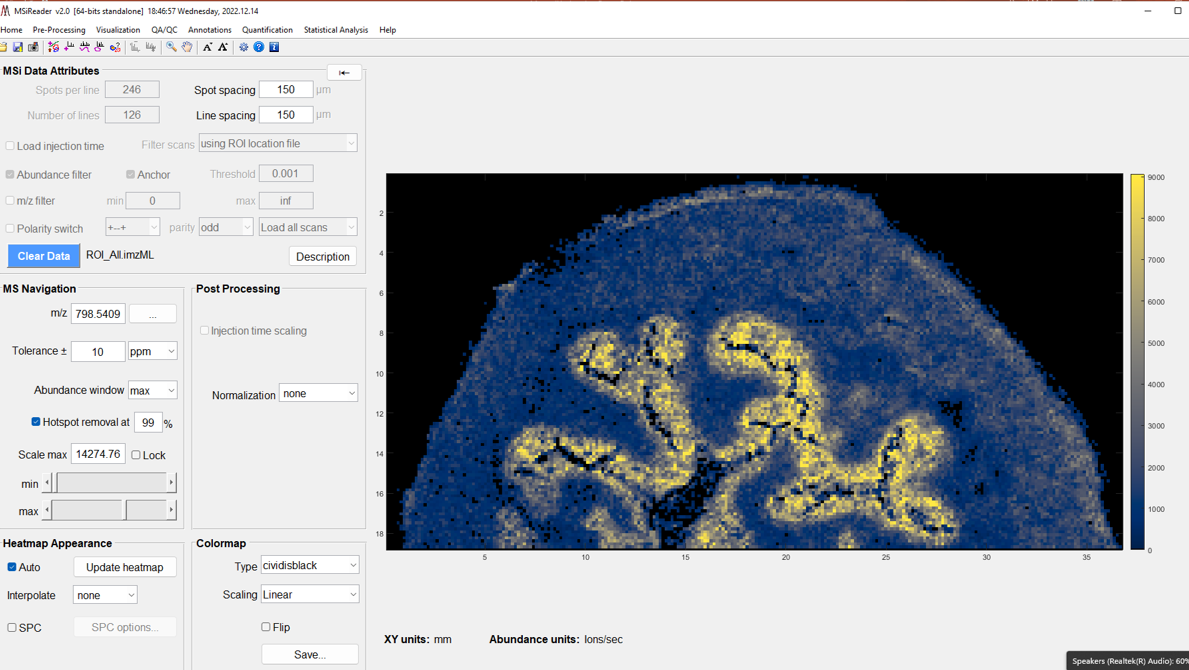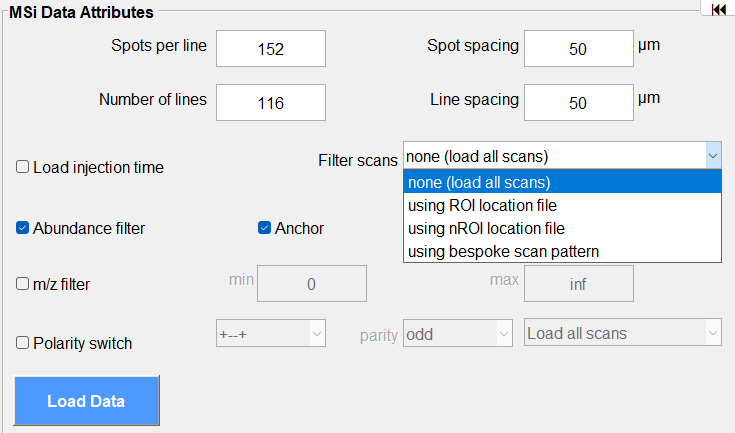
Figure 9: How to load a dataset using a locator file. For example, data collected using an arbitrary ROI. This feature filters the scans of interest using the .txt locator file that must be present in the same folder as the imzML file.
3 Supported Data File Formats
Several different data formats can be read with MSiReader: an imzML file (single file and multi-select), an mzXML file (single file and multi-select), an IMG (Analyze7.5) file, a folder of ASCII files (one per scan), a MSI saved session file (*.mss) which is a previously saved MSiReader session and a *.mim file custom format to MSiReader. Finally, loading *.mss, *.mim, or loading native instrument files is now available and steps to load Thermo *.raw files directly can be found in §7.1 and §8.2 (these all require a paid subscription). Steps to load each type are described below.
3.1 imzML File Format
This file format was developed by the EU project Computis8 to efficiently store and share mass spectrometry imaging data. It is the preferred format for MSiReader since it contains the required meta-information, it is compact, and it loads faster than the other formats. An imzML data set consists of two files, one XML file (imzML extension) that contains the metadata such as the instrument parameters and the scan pattern information and a binary file (.ibd extension) that contains the mass spectrometry data. There are multiple converters that can translate directly from a vendor’s format to imzML. Users can also use MSConvert from Proteowizard to convert vendor’s format to HUPO-PSI’s mzML and then use imzMLConverter to convert the mzML file to imzML format. Recently a user-friendly validation and editing tool, the imzMLValidator9,10 has become available to ensure that converted files conform to the standard. Please use the imzMLValidator if you have problems loading your data. It includes tools to repair incorrect metadata and to add missing metadata. imzML files can be generated in processed (one m/z array per scan) or continuous mode (one m/z array per file). Both continuous and processed formats can be loaded into MSiReader, but the user must be careful to choose the appropriate format for the type of instrument used when converting a file to imzML.
For the imzML format, datasets typically include the Spots per Line, Number of Lines, Spot Spacing and Line Spacing parameters. Spots per Line and Number of Lines must be present. If Spot Spacing or Line Spacing are not in the file and cannot be determined from other imzML accession values, the current values in the MSi Data Attributes pane are used. After the file is read, these can be modified by the user manually to obtain the correct plot scaling and aspect ratio.
Note 1: Alternate regular expression based imzML file parser. If there are errors reading an imzML file, you can try an alternative regular expression-based parser included with MSiReader to search for the required header information. But first, you should use the imzMLValidator discussed above to repair any problems with your file. To enable the alternate expression parser, set the MSiReader preferences INI file (§5) variable imzMLRegexpParams value to true. If you still have problems loading it with MSiReader please send an error report with a screenshot of any error dialog messages to support@msireader.com.
Figure 9: How to load a dataset using a locator file. For example, data collected using an arbitrary ROI. This feature filters the scans of interest using the .txt locator file that must be present in the same folder as the imzML file.
For an ROI of any shape (polygonal, rectangular or an arbitrary arrangement of scans), a text file (.txt extension) describing the position of each scan can be used to load an imzML file. The .txt location file must be in the same folder as the imzML file. This feature is enabled under Filter Scans pull down menu in the MSi Data Attributes pane (Figure 9).
Select under Filter Scans “using ROI location file” or “using nROI location file”. More information is discussed below in Notes 3-6. This feature is also useful for reading a portion of a very large file that might otherwise exhaust the memory of your computer.
Note 2: Alternate text based imzML parser in MSiReader v3.12; this is a text-based imzML parser that can be used instead of the Java parser distributed with the imzMLConverter. The first time a file is loaded the parser reads and parses the imzML data set and creates a small file that it saves in the same folder as the imzML and .ibd files, using the same name. The new file has the extension .ibh. When the data set is loaded again, MSiReader loads the .ibh file and then the scan data without reading or parsing the imzML file. The new parser can be significantly faster than the imzMLConverter: about 20% faster for the first load and as much as 70% faster for files with a large number of scans after the .ibh file is created. It is enabled by setting the preferences INI file (§5) variable, UseFastimzMLFileLoader to “true”. The imzMLConverter can be used if you prefer or if you have problems loading a data set.
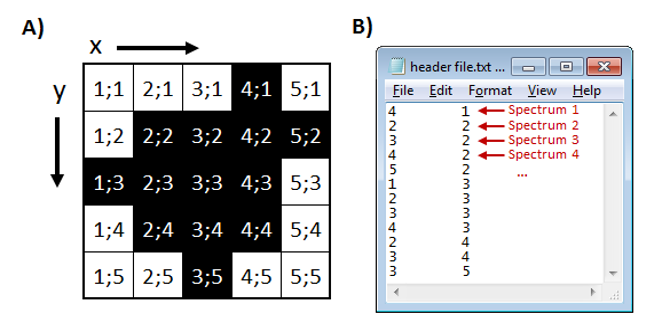
Figure 10: Location file format for non-rectangular ROI. A) Grid showing x and y of location where spectra were collected (black) and B) location file associating the location where each spectrum is located on the grid.
Note 3: Location files for an ROI of any shape. The format of an ROI location file is similar to the one used by the imzMLConverter and is presented in Figure 10 in its simplest form. Each line of the file contains the X, Y location of a scan in the image file. By default, the smallest enclosing rectangular image (5 × 5 for this example) will be generated with an empty scan placeholder for unloaded scans. The preferences INI file (§5) variable SqueezeROIEmptyScans is a two-element logical vector that is used to expand the column and row dimensions to their original size in the image and fill with empty scans or to squeeze completely empty columns and rows from the image. For the example, setting SqueezeROIEmptyScans to “true false” will reduce the number of columns to 5, but will not reduce the number of rows in the loaded image. Empty columns and rows are removed according to these parameters regardless of how they became empty (ROI filter, m/z range filter, abundance filter, bespoke user scan filter, or polarity filter). If you prefer to only remove completely empty columns and rows from the border, preserving the spacing in the interior of the ROI, set the preferences INI file (§5) variable, SqueezeROIBorderScansOnly to “true”. Your image will be cropped to the smallest enclosing rectangle.
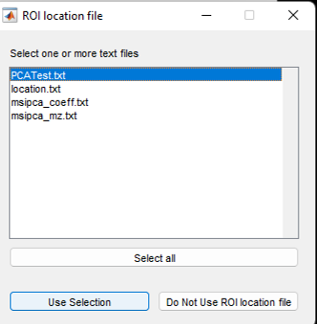
Figure 11: ROI location file selection dialog.
Prior to loading an imzML file, if the “using ROI location file” was selected, the user will be prompted (see Figure 11) to select a text file containing the ROI information for that dataset.
Note 4: Alternate location file formats. If the location file contains 3 or more columns of numeric values, the first column is taken to be the scan number and columns 2 and 3 are the x and y locations of that scan. If a 4th column is present, it is read and ignored unless its value is less than or equal to zero in which case that scan is skipped. This can be useful for loading a portion of an ROI or selectively excluding individual scans without creating a new location text file. If a file containing a single column of values is selected then those values are interpreted as scan numbers and the x and y locations are calculated using the Spots per line value (i.e., number of columns) as
![]()
![]()
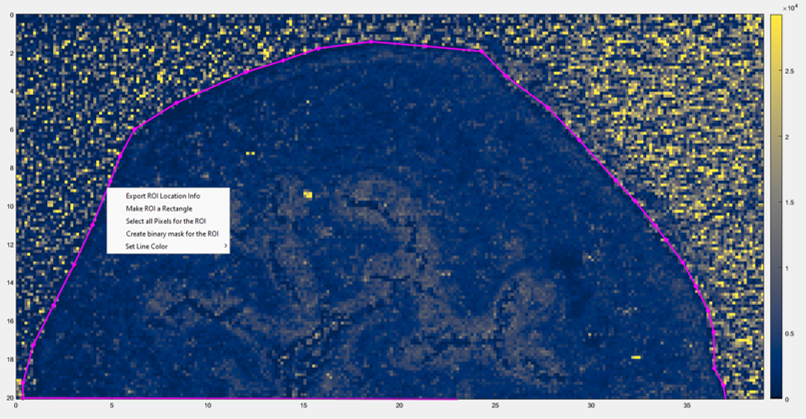
Figure 12: How to access the Export ROI Location Tool in MSiReader. It is a context menu (right click on the heatmap) after you have selected an ROI using the polygon selection tool.
Note 5: Loading an image ROI saved with the MSiReader Export ROI Location info. The file format generated by the Export ROI tool can be used as a location file as described above in Note 3. Load your imzML file into MSiReader and then using the pixel, line or polygon ROI tool using the appropriate ICON (§4.2), select the ROI. Next, right click to access the context menu (Figure 12) in MSiReader and select “Export ROI Location Info” (this is for the polygon tool as shown with the purple line). You will be prompted to enter a filename, and it should default to the same folder where your imzML data is stored.
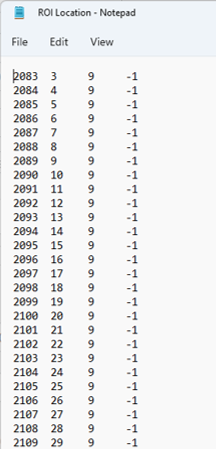
Figure 13: Table showing the structure of the location file generated using the Export ROI Location Tool. Notice that in the fourth column, the values are all -1 which means those scans will be skipped when loading the data with the ROI location file. Inspection of the ROI in Figure 12 will show that starting in the top lefthand corner, the ROI that has been drawn (purple line) excludes these data.
The structure of the ROI location file you just created is shown in Figure 13. The first column is the scan number, the second and third columns are the x, y locations and the fourth column is read and ignored unless its value is less than or equal to zero in which case that scan is skipped.
You can now reload the original dataset but use the location file to only include data in the ROI that you just created (shown in Figure 14). To do this, you select “using ROI location file” in the MSi Data Attributes pane using the pull-down menu “filter scans” and then load the imzML file. It will prompt the user to select the location file (Figure 11). Select the location file and the click “Use Selection” and it will load only data that was chosen in the location file. In the folder with the data is a text file “ROI Location.txt” that can be used to reproduce the data in Figure 14.
Note 6: nROI is a feature to visualize data that was collected with two different spatial resolutions. This will take the lower resolution and fill in a 2 by 2 pixel with one pixel using the same data and retain the XY dimensions of your data while the higher spatial resolution data will be displayed natively. This feature is used when you have a large ROI and want to image the entire tissue but with some regions within the ROI (called the nested ROI or nROI) collected at a high spatial resolution.
3.2 mzXML File Format
mzXML is an open representation for MS data introduced by Pedrioli et al.6 An mzXML file can be obtained from RAW data using the MSConvert tool from Proteowizard.5 The mzXML format does contain most of the information about the instrument parameters but does not contain the spatial information necessary to associate each spectrum to a scan location on the image. If you are using the mzXML format for a rectangular ROI in fly back mode (left to right, top-down) image, you need to manually enter the number of spots per line and the number of lines per row BEFORE loading the file. An alternative is to use the text format described in Note 7 below to automatically load those parameters.
For an ROI of any shape, a text file describing the position of each scan can be used to load mzXML files. This feature is enabled prior to loading the mzXML file type in the MSi Data Attributes pane by selecting using ROI location file in the filter scans pull down menu. If this option is checked, the user will be asked to select a file as described in Notes 3, 4 and 5 above.
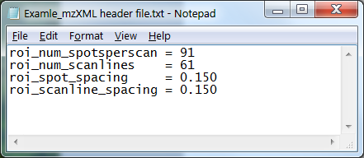
Figure 15: Example of optional header file for rectangular ROI (fly back mode). Spot spacing and scan line spacing parameter units are in mm.
Note 7: Header file for Rectangular ROI in Fly back mode. If you have developed your own imaging source control software that automatically saves a text file that contains the four spatial parameters mentioned above in a format similar to the MSiReader preferences INI file (§5), MSiReader will look for this file when loading an mzXML file (or folder of mzXML files). Instead of manually entering the values, you can create a text file containing the following four lines in the same folder as the mzXML file(s) you are reading. See example in Figure 15. If there is more than one text file present in that folder, you will be asked to choose the correct one (see example that was shown in Figure 11). If no suitable .txt file is selected, the values entered on the main GUI of MSiReader will be used (which you can see after loading the mzXML file).
If the mzXML file does not contain the correct number of scans (i.e., Spots per Line * Number of Lines), the user is given the option to read the file anyway discarding extra scans or padding the image with empty scans or to select any of the possible rectangular dimensions that will load all of the scans from a list. See Figure 16 and Figure 17 below.
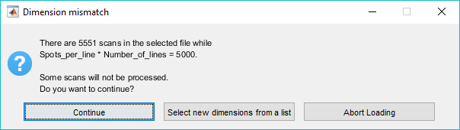
Figure 16: Dimension mismatch dialog box for an mzXML data set.
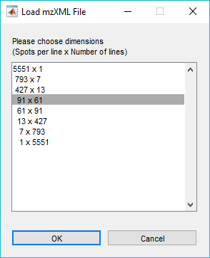
Figure 17: Dimension selection dialog for an mzXML data set. Based on the total number of scans, this dialog box suggests logical data structures.
3.3 IMG File Format
IMG or Analyze 7.5 is a file format originally developed by the Mayo Clinic to share MRI imaging data. It consists of 2 files: a binary file (.img) that contains the actual data and a header file (.hdr) with content details about the image such as the size and position of scans (spot spacing, line spacing, etc.). A third file (.t2m) containing the corresponding m/z array was added by Stoeckli et al. to adapt the Analyze 7.5 format for MSI data when developing Biomap. All three of these files are required by MSiReader. If the images are inverted compared to what you expect, you can change the IMGFlipRows value to false in the preferences INI file (See §5). As with the imzML and mzXML formats you can also change the Spot Spacing and Line Spacing parameters after the file is loaded, using a negative value to flip the image along the corresponding dimension.
Note 8: Filtering low abundance data points. IMG format files are continuous (same m/z values for every scan) and may contain many spectral pairs with zero or very low abundance. If your data set is large, you should enable the abundance threshold filter to reduce the memory requirements and speed up data processing (§2.4.4).
Note 9: File buffering. The performance of scan loading is greatly improved if a group of scans is read at once into a buffer and then each scan is extracted, processed and saved. However, for some files memory may be exhausted during file loading by a large number of low abundance values that will eventually be filtered out. Two preferences INI variables (§5) are used to control buffered IMG file loading. IMGLoadBufferSize is the amount of memory in megabytes reserved for the buffer. The default is 40. For files with a large number of m/z values, a buffer of this size may only hold a few scans. In this case, it is more efficient to revert to reading one scan at a time. The IMGBufferScanThreshold variable is the number of scans per buffer below which scan-by-scan loading is used. The default value is 20.
Note 10: ROI Location Files. If an ROI location file is being used to load a portion of an IMG data set, the ROI must have been saved with the same IMGFlipRows setting that is being used to load the data. Otherwise, the wrong scans will be loaded.
3.4 imzML Folder
A collection of imzML files can also be loaded into MSiReader (you can also use the CTRL button to select a subset of the files in the folder); all files must be placed in a single folder and named sequentially as anyname1.imzML, anyname2.imzML, anyname3.imzML, etc. If the file names do not end with a numeric suffix they will be read in alphabetic order. The arrangement of the files into a tiled image mosaic is row-major order (i.e., row 1 is filled left to right, then row 2, etc.).
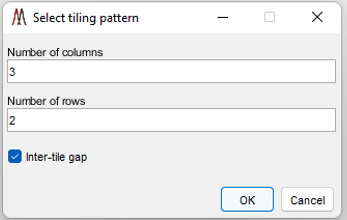
Figure 18: Tiling pattern dialog for a folder of imzML images (or multi-select).
The user is prompted to enter the number of columns and rows of tiles in the mosaic with a dialog as shown in Figure 18. The default values are for the smallest rectangular arrangement that can include all the files. If there are more files in the folder than the product of the columns and rows in the tiling pattern some of the files will not be read. If there are fewer files, the last row will be filled with empty tiles. Extra, completely empty rows are not created. There is also a checkbox called inter-tile border. Selecting this option will insert a white border around each loaded dataset (see Figure 74 for an example) which is greatly preferred when viewing multiple datasets and when generating publication quality figures.
It is convenient if a user labels their files in order of which sample type they are derived from. For example, if a user has 5 cancer tissue and 5 healthy tissues, it would be best to label the 5 cancer tissues as filename1-filename5 and the 5 healthy tissues filename 6-filename10. Then, when loading, the user should choose 5 columns and 2 rows. This will make ROI selection and data export much easier to remember and visually easier to understand differences between the two sample types. However, this is not a necessary step.
The imzML files need not have the same ROI. Each file is centered in its tile with an optional empty scan separator between tiles along with as many empty columns and rows as needed to make the mosaic pattern plaid. That is, each tile in a row has the same number of columns and each tile in a column has the same number of rows. The preferences INI file (See §5) variable TileScanSeparator can be set to false if you do not want an empty scan line and empty scan column between tiles.
Location files as described in Notes 3, 4, and 5 above can be used with imzML folders; however, there is an important difference. The scan number and X, Y values in the location file refer to the position of a scan in the mosaic. Additional columns are needed to specify the original location of the scan in its file. All that is needed are the file number and the local scan number. This information is created automatically when the ROI export tool described in §2.4.3 is used to create the file. A portion of such a file is shown in Figure 19. Saved location files are thus dependent on the tiling pattern and line and spot spacing when they were created.
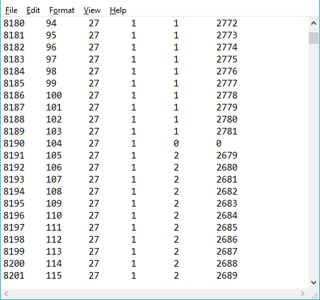
Figure 19: Example of an ROI location file for a folder of images. The first four columns are the scan number and x,y,z location in the image mosaic. The last two columns are the source file number and scan number. File number 0 and scan 0 are used for the empty scan separator.
3.5 mzXML Folder
For cases where the imaging data originates from multiple instrument files, it is possible to load multiple mzXML files into MSiReader. To do so, they must be placed in the same folder and named sequentially as anyname1.mzXML, anyname2.mzXML, anyname3.mzXML, etc. If the file names do not end with a numeric suffix they will be read in alphabetic order. Since the mzXML files are a sequence of scans and do not contain spatial information, there are two ways that MSiReader can arrange the scans into an image based on external information.
Stream mode. Scans from the files are read sequentially and distributed across columns and down rows to form a single image. Either the Spots per Line and Number of Lines values from the MSi Data Attributes panel are used to set the image size or an mzXML info text file is selected as described in Note 5 above. Dimension mismatches are handled in the same manner as for a single mzXML file.
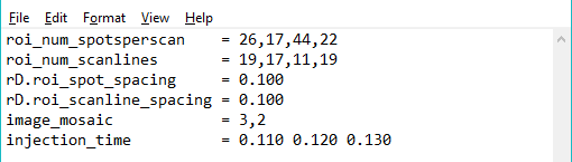
Figure 20: Example of an mzXML header text file for a folder of images. In this example there are four files with dimensions 26 × 17, 17 × 17, 44 × 11, and 22 × 19. They will be arranged into a tiled image with 3 columns and 2 rows.
Tiled mode. Scans from each file are read as a single image and the images from the files are arranged into tiles in the same manner as for an imzML folder. In this case the number of spots per line and number of lines in each file must be specified as well as the number of columns and rows of tiles in the image mosaic. This can be done by 1) entering a vector of numbers for the Spots per Line and Number of Lines values in the MSi Data Attributes pane or 2) the spotsperscan and scanlines values in the descriptive text info file can be expanded into a list of integers, one value for each mzXML file. The tiling pattern may also be specified in this file using an additional parameter, image_mosaic, whose value is two integers: the number of image columns and the number of image rows. See Figure 20. If image_mosaic is omitted the images are tiled into a single column or a single row. The choice is made automatically in favor of the smallest aspect ratio for the resulting image mosaic.
3.6 ASCII Folder
Table 1: ASCII data file format variables
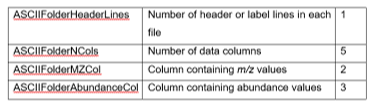
The ASCII format consists of multiple files grouped in a folder where each file contains the mass spectrometric data for a single scan and the name of the file identifies the location of the scan in the image (see Figure 21 for more details about the file format). This was one of the output options for previous generations of Bruker instruments (converted using their CompassXport software). Although it is not a very common file sharing format it is supported by MSiReader and can be easily implemented by MSI groups developing an imaging source with in-house built instruments or those wanting to visualize post-processed data. Note that this format supports non-rectangular and unconnected regions of interest. If data is only available over a region of interest that is not rectangular or sparse, empty scans will be created to convert the region into the smallest rectangle enclosing all the scans in the ROI. Four preferences INI file (§5) variables are used to specify the format of the file as shown in Table 1. The default values are correct for the Bruker ASCII files.
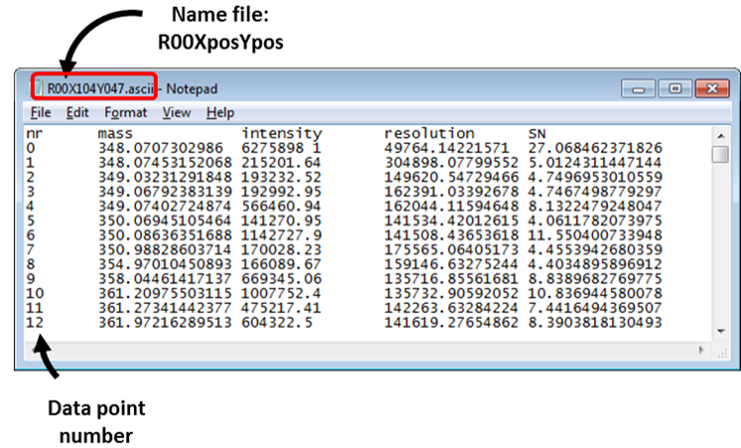
Figure 21: ASCII file format. The folder should contain one file per image scan and each file is named after the location of the scan. The file names are arbitrary, provided that each contains the letter ‘X’ followed by a sequence of numerals and the letter ‘Y’ followed by another sequence of numerals. The names are not case sensitive. MSiReader will read the two columns of the file that contain the m/z value and the abundance. In this case (Figure 19) columns 2 and 3. The header label line and the other columns are ignored. The columns are delimited with spaces, tabs, or commas.
3.7 Loading Native (Thermo *.raw), *.mss and *.mim File Formats
Once a data file of any type (Pro or BioPharma) has been loaded into MSiReader, the user is given the option to save the active session in a binary *.mss or *.mim file format for later use. Please see §7.1 and §8.2 for more information.