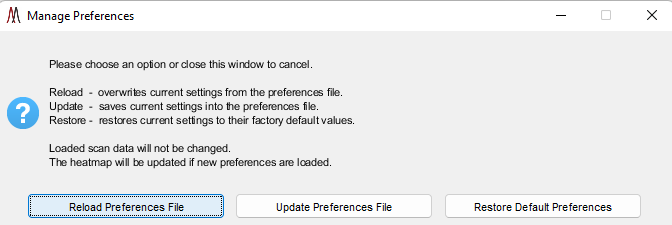
Figure 24: Manage preferences file while using MSiReader. Descriptions for each choice are provided in the dialog box which include Reload, Update, and Restore.
5 Customizing MSiReader Pro – the Preferences .INI file
A video tutorial can be found HERE on how to customize your MSiReader experience.
Note: Some of these preferences apply only to MSI data streams while others apply to both MSI and HTS/HCS data streams.
A plain text preferences file is read by MSiReader on startup that contains most of the default settings and function parameters. Editing it allows the user to easily change settings to customize the UX in MSiReader, so the default edit box values and checkbox options are the ones that you commonly use. Recall that you can edit the preferences and reload them without restarting MSiReader or affecting the loaded data set. This file is in the installation folder. It is called MSiReaderPrefs.INI and contains the fields in Table 2 below in the same order that they are listed in the table. The file is divided into sections for different GUI’s in MSiReader. Non-numeric values (e.g., color names, interpolation types) should not be surrounded by quotation marks unless otherwise noted. The alternate colormap selector and the alternate spectrum plot are used regardless of the settings in the preferences file. Finally, the user can always export data to text files (.txt) instead of Excel workbooks by setting ‘ExportToExcel’ to false.
Figure 24: Manage preferences file while using MSiReader. Descriptions for each choice are provided in the dialog box which include Reload, Update, and Restore.
The end user can change numerous settings and save them as the default parameters. When MSiReader is launched it will use these settings to avoid the user having to change these parameters each and every time the program loads. As the user becomes more knowledgeable about the parameters described below and how they relate to their research, they can revisit the .INI file in the MSiReader folder (.txt file) to make changes, save them and then reload MSiReader. If MSiReader is already in operation, you can make changes to the .INI file and then reload .INI file using the following steps including restoring the default parameters. Click on the ![]() icon in the toolbar. Upon doing so, the dialog box shown in Figure 24 is displayed. Note that restoring to the default values does not change your preferences INI file, rather it changes the current in-memory settings by loading a copy of the default values that is saved in the \msiresources folder. If you are processing data and have all your settings that you prefer for current and future sessions using MSiReader, simply click the “Update Preferences File” in the dialog box (Figure 24) and these will save the settings into the .INI file.
icon in the toolbar. Upon doing so, the dialog box shown in Figure 24 is displayed. Note that restoring to the default values does not change your preferences INI file, rather it changes the current in-memory settings by loading a copy of the default values that is saved in the \msiresources folder. If you are processing data and have all your settings that you prefer for current and future sessions using MSiReader, simply click the “Update Preferences File” in the dialog box (Figure 24) and these will save the settings into the .INI file.
If you have a request to add additional attributes to the .INI preferences file, please email us at support@msireader.com.
Table 2 below shows the list of parameters that can be customized to improve the end-user experience. The entries in this table match the order of the entries in the .INI file stored in the installation folder and the values in the table are the values in MSiReaderPrefs.INI after installation.
This page intentionally left blank.
Table 2: MSiReader v3.12 Preferences .INI File
Parameter Name | Default | Description |
[MSiPrefs] | ||
MSiReader main window | ||
Loadtype | imzML File (single or multiple files) | Default file type. Other options are mzXML File, IMG File, ASCII Folder, and MSS File. |
NCol | 100 | Default value for the number of columns in the data set. |
NRow | 100 | Default value for the number of rows in the data set. |
XSpacing | 150 | Spacing in µm between scans across the columns. |
YSpacing | 150 | Spacing in µm between scan down the rows. |
mzCenter | 369.3516 | Default value for m/z when a file is loaded. If it is out of range, the median m/z value of the loaded data will be used instead. |
mzCenterHistoryLength | 100 | Number of previous m/z values to save in the navigation history list. The value must be between 1 and 1000. |
mzStep | 0.01 | Default value for m/z step. |
mzWindow | 2.5 | Default m/z window size value. |
mzWindowUnits | ppm | Default m/z window units. Specify either Th for Thomson or ppm for parts-per-million. Default is ppm. |
mzWindowStyle | tolerance | Meaning of the window size value. Window means it is the full window width, tolerance means it is one-half the window width. |
Pixelation | window max | Method used to calculate abundance: window sum, window mean or window max. |
MaxColorScale | 100000 | Default Scale Override value. The value is changed to the actual maximum abundance when a file is loaded. |
NormalizeOption | none | Default normalization option. Specify either none, Ref Peak, TIC, Max, Mean, Median, Midpoint or Custom. The Custom option is only available after custom heatmap data has been loaded. |
NormScale | 1 | After normalization, all abundance values are multiplied by this value. |
NormCutoff | 1 | Minimum abundance value for normalization peak in any given spectrum for normalization to be applied. |
NormPeak | 519.14 | Default value for reference peak normalization. |
LocalTICNormBoundaries | 200 600 1000 | Default m/z ranges for local TIC normalization |
BaselineThreshold | 10 | Minimum number of data points for baseline correction. |
mzResampleOption | roi scans | Default option used for resampling mass spectra when averaging is performed. Values are, roi scans : Resample to all m/z values from the scans in the ROI. all scans : Resample to all m/z values from all scans in the image. uniform : Resample uniformly over the full m/z range with a “match” tolerance. |
mzResampleMaxPts | 1e+7 | Maximum number of resampled m/z values allowed. |
ItType | linear | Default heatmap interpolation type. Other options are spline and cubic. |
ItOrder | 0 | Default heatmap interpolation order, 0 to 5. |
ColorMap | cividisblack | Default colormap. Other options are discussed in §6.2.6. |
LogColorScaleBase | 10 | Base used for logarithmic color scale mapping, one of 10, 2, or e. |
MaxLogColorBarLabels | 15 | Maximum number of logarithmic colorbar labels. |
MMAColormap | cividishi | Colormap for mass measurement accuracy plots. |
MMAHistogramDirection | vertical | Direction of the bars in a mass measurement accuracy histogram. Vertical or horizontal. |
MMAHistogramBinMethod | auto | Binning method used to create a histogram. Possible values are: auto, scott, fd, integers, sturges, or sqrt. |
MMAHistogramMargin | 2 | Margin for mass measurement accuracy histogram plots. Units are ppm. |
DefaultFontSize | 9 | Default Font Size for MSiReader GUI’s |
File loading | ||
ResetLoadOptions | false | Set to true to reset the options for data set loading (including the data set type, ROI location file prompt, polarity switching and filtering, etc.) to their default setting when a loaded data set is cleared. |
AbundanceFilterEnable | true | Default setting for the abundance filter. See §2.4.4. |
MinAbundanceThreshold | 0.001 | Abundance threshold for a data point to be created in the MSi structure when loading data. Smaller values are removed as each scan is loaded. See |
FilteredPeakAnchor | true | Default setting for “smart” abundance filtering, whereby a consecutive sequence of low abundance values is replaced by two zero values, one at each end of the sequence. See §6.2.1. |
NoFilteredPeakAnchorCentroid | true | Default setting when centroiding data to anchor peaks to baseline. |
mzFilterEnable | false | Default setting for the m/z range filter. See §6.2.1. |
mzFilterMin | 0 | Minimum m/z value allowed in the filtered data stream for each scan. |
mzFilterMax | Inf | Maximum m/z value allowed in the filtered data stream for each scan. |
SqueezeROIEmptyScans | true true | Removes empty columns and rows, respectively, from the image. |
SqueezeROIBorderScansOnly | false | Remove only the empty columns and rows around the border of an image. |
UseFastimzMLFileLoader | true | Enables fast text-based parsing of imzML files. Set to false to use the JAVA based imzMLConverter instead. |
EnableUUIDimzMLWarning | true | Warn the user if imzML and ibd universally unique identifiers do not match. Set to false to suppress the warning dialog. |
ImzMLRegexpParams | false | Use an alternate, regular expression-based method of reading imzML header information. |
ImzMLDimensionWarning | true | The user is warned if an imzML file does not contain sufficient information to set the X and Y pixel sizes. |
LoadInjectionTime | false | Initial state of the load injection time main GUI checkbox. |
LoadScanStartTime | false | |
IMGLoadBufferSize | 40 | Size of IMG file load buffer in megabytes. |
IMGBufferScanThreshold | 20 | Minimum number of scans per buffer to use buffered loading instead of reading one scan at a time. |
IMGFlipRows | true | Flip IMG file by rows after it is loaded. |
ASCIIFolderHeaderLines | 1 | Number of header and labels lines in an ASCII format data file. |
ASCIIFolderNCols | 5 | Number of columns of data in an ASCII format data file. |
ASCIIFolderMZCols | 2 | Column containing the m/z values in ASCII format data file. |
ASCIIFolderAbundanceCol | 3 | Column containing the abundance values in an ASCII format data file. |
TileScanSeparator | true | Insert an empty column and an empty row between the tiles in an image mosaic. |
MissingTICWarning | true | Display a message “Total Ion Current was not found in the original file and will be calculated instead” if TIC values were not found in the file. Set to false to disable display of the warning dialog. |
Peak picking and ROI spectrum export | ||
IntPeakCutoff | 80 | Default selection criteria for peak picking. The minimum percentage of scans in which an m/z must occur in the interrogated ROI to be a candidate when peak picking. See §7.7.1. |
RefPeakCutoff | 20 | Default selection criteria for peak picking. The percentage of scans in which an m/z can occur in the reference ROI to be a candidate when peak picking. See §7.7.1. |
MinPeakRatio | 2.0 | Default selection criteria for peak picking. See §7.7.1. Abundance ratio threshold for a peak that doesn’t meet the RefPeakCutoff criteria. |
AllROIScans | true | |
PeakThreshold | 100 | Default selection criteria for spectrum export and peak picking. See §7.6.6. Minimum abundance for an m/z to be considered when peak picking. |
PeakAlgorithm | Parabolic Centroid | Algorithm for spectrum export and peak picking. See §7.6.6. Choices are: Parabolic Centroid, MS Peaks, or Local Maxima. |
ViewPeaks | true | Default value for spectrum export and peak picking. See §7.6.6. Plot the average spectrum for the ROI. |
IncludePeakMarkers | true | Default value for spectrum export and peak picking. See §7.6.6. Markers for the peaks are included in the spectrum plot. |
ExportPeaks | true | Default value for spectrum export and peak picking. See §7.6.6. |
ExportPixelPeaks | false | Default value for spectrum export and peak picking. See §7.6.6. |
SendPeakstoClipboard | true | Default value for spectrum export and peak picking. See §7.6.6. The m/z values for the peaks found are sent to the clipboard. |
AppendtoClipboard | true | Default value for spectrum export and peak picking. See §7.6.6. Peaks are appended to the current clipboard contents. Set to false to replace the clipboard contents instead. |
IncludeAbundance | false | Default value for spectrum export and peak picking. See §7.6.6. The exported data file includes abundance values for each m/z in the peaks list. |
SpectrumAverageAllScans | false | Set to false to average only the scans with abundance greater than the threshold. |
SpectrumAverageThreshold | 100 | Abundance threshold for the spectrum averaging. |
ExportToExcel | true | Default value for spectrum export and peak picking. See §7.6.6. If set to false, data will be exported to a text (.txt) file. |
ExportPixelsToText | false | Set to true to always export full scan values for ROI scans into a text file, regardless of the number of scans or the number of m/z, abundance values. |
UseXLSTemplate | true | Default value for spectrum export and peak picking. See §7.6.6. A template file is used for exporting peak picking and spectrum ROI data to Excel workbooks. |
ExportSpectrum | false | Default value for spectrum export and peak picking. See §7.6.6. The average m/z, abundance values for the scans in the ROI are included in the export file. |
MaxMarkerstoView | 50 | Number of markers to trigger a confirmation dialog before calling msviewer when peak picking or exporting a spectrum. |
CursorColor | magenta | Color of cursor for scan selection in spectrum extraction. Valid color values are blue, green, red, cyan, magenta, yellow, black, white. |
SpectrumROIColor | magenta | Color of tool for ROI selection in spectrum extraction. Valid color values are blue, green, red, cyan, magenta, yellow, black, white. |
InterrogatedROIColor | magenta | Color of tool for ROI selection in Peak Picking (interrogated zone). Valid color values are blue, green, red, cyan, magenta, yellow, black, white. |
ReferenceROIColor | green | Color of tool for ROI selection in Peak Picking (reference zone). Valid color values are blue, green, red, cyan, magenta, yellow, black, white. |
ExportSpectrumChunk | 1000 | Target number of values to write to Excel at a time. A larger value will use more memory but may be faster. Note that progress bar updates will also be less frequent. |
TextExportChunk | 1000 | Number of lines to write to a text file between progress bar updates. |
ROISelectorStyle | polygon | Type of region of interest selector tool. Possible values are polygon, rectangle or freehand. |
ROISaveLocationToMAT | true | Saves ROI location info into a MAT file reloading the ROI into MSiReader. |
SpectrumPlotStyle | line | Plot style for spectrum plots. Possible values are line, stem or stairs. |
SpectrumPlotMarkerStyle | point | Marker style for spectrum plots. Possible values are point or line. |
Database Annotation | ||
mzMatchTolerance | 5 | Tolerance for matching target m/z values to key values in an annotation database. Units are ppm. |
AnotatePeaks | false | Default peak annotation setting for MSiSpectrum (§7.6.6) and MSiPeakfinder (§7.7.1). |
LoadDatabasesOnStartup | false | Loads the positive and negative ionization database files when MSiReader starts. They will be loaded when needed by MSiDatabase (§7.7.1), MSiSpectrum (§7.6.6) or MSiPeakfinder (§7.7.1) if set to false. |
IncludeNullMatchResults | false | When set to true only the peaks that match a key in the selected ionization database will be saved in results files. If false, peaks that match database keys will have additional columns of information from the database, other exported peaks will have empty annotation columns. |
PositiveIonDatabaseFile | MSiReaderPositiveIons.xlsx | Name of the position mode ionization database workbook file. The full path and name must be given if the file is not in the MSiReader installation folder. The example included in the installation is MSiReaderPositiveIons.xlsx. |
PositiveIonWorksheet | Lipid Ions | Name of the worksheet in the positive ionization workbook containing the annotation information and m/z key values. |
PositiveIonKeyColumn | 6 | Column of the positive ionization m/z key values. |
PositiveIonInfoColumn | 1 2 3 4 5 | List of columns to include as annotations for matching key values in an exported worksheet. |
PositiveIonHeaderRow | 1 | Row in the positive ionization worksheet containing column labels for the annotation information. |
PositiveIonFirstRow | 2 | First row containing data in the positive ionization worksheet. |
NegativeIonDatabaseFile | MSiReaderNegativeIons.xlsx | Name of the negative mode ionization database workbook file. The full path and name must be given if the file is not in the MSiReader installation folder. The example included in the installation is MSiReaderNegativeIons.xlsx. |
NegativeIonWorksheet | Lipid Ions | Name of the worksheet in the negative ionization workbook containing the annotation information and m/z key values. |
NegativeIonKeyColumn | 6 | Column of the negative ionization m/z key values. |
NegativeIonInfoColumn | 1 2 3 4 5 | List of columns to include as annotations for matching key values in an exported worksheet. |
NegativeIonHeaderRow | 1 | Row in the negative ionization worksheet containing column labels for the annotation information. |
NegativeIonFirstRow | 2 | First row containing data in the negative ionization worksheet. |
MSiPeaksDatabaseFile | Name of the peaks database workbook Excel file. The full path and name must be given if the file is not in the MSiReader installation folder. | |
MSiPeaksWorksheet | Centroid data | Name of the worksheet in the peaks workbook containing the annotation information and m/z key values. |
MSiPeaksmzKeyColumn | 1 | Column of the peaks m/z key values. |
MSiPeaksInfoColumns | 2 | List of columns to include as annotations for matching key values in an exported worksheet. |
MSiPeaksHeaderRow | 1 | Row in the peaks worksheet containing column labels for the annotation information. |
MSiPeaksFirstRow | 2 | First row containing data in the peaks worksheet. |
Image overlay | ||
ImgMoveResizeColor | magenta | Color of tool for moving and resizing an optical image in MSiImage. Valid color values are blue, green, red, cyan, magenta, yellow, black, white. |
ImgCropColor | green | Color of tool for cropping an optical image in MSiImage. Valid color values are blue, green, red, cyan, magenta, yellow, black, white. |
ImgAlpha | 0.5 | Default optical image overlay transparency. |
ImgBorder | 0.1 | Size of the empty border region around the heatmap plot drawn by MSiImage. Expressed as a percentage of the heatmap size. Valid values are between 0 and 1. |
ImgRotateMag | 0.2 | MSiImage rotate tool magnification factor. Smaller values move the object slower than the mouse. Valid values are between 0.01 and 1. |
Figure export | ||
ExportFileType | png | Default exported graphics image type. Other options are bmp, emf, eps, jpg, pdf, tif. |
ExportFigureSize | 880 440 | Width and height in pixels of an exported figure window as reported by MATLAB. The figures can be resized after they are created. |
ExportFigTitleStyle | trim | Exported figure title style. Valid values are full, trim, batch, metaspace, none or a binary character mask. The default is trim. Trim contains the data set comment string (if any) and the m/z value and window size. Full also includes the file name, dimensions, interpolation option, abundance display option and normalization setting. |
ExportFigAxes | true | Include or exclude axis scales, labels and tick marks from exported figures. |
ExportFigAxesLabels | true | Include or exclude axis labels from exported figures. |
ExportFigColorbarStyle | compact | Style of the colorbar for exported figures: one of compact, fixed, exponent, general, auto or none. Compact is the default. |
ExportFigColorbarLabels | 6 | Number of labels on the colorbar of exported figures. |
ExportFigColorbarPrecision | 2 | Number of digits to the right of the decimal point displayed for exported figure colorbar abundance labels. |
ExportFigFontName | Arial | Font name for text in exported figures. Any installed font can be specified. |
ExportFigFontSize | 12 | Font size for text in exported figures. |
ExportToMAT | false | Save a MATLAB MAT file containing Xdata, Ydata and Zdata when the heatmap plot is exported as a graphics format file. |
ExportToFIG | true | Save a MATLAB FIG file for exported heatmap figures in addition to the graphics format file. |
Batch Processing | ||
BatchFileNameStyle | 1 | The naming convention for exported batch image files. |
BatchFileType | png | Default batch graphics image type. Other options are bmp, emf, eps, jpg, pdf, tif. |
BatchFigureSize | 880 440 | Width and height in pixels of a batch figure window as reported by MATLAB. The figures can be resized after they are created. |
BatchFigTitleStyle | metaspace | Batch figure title style. Valid values are full, trim, batch, metaspace, none or a binary character mask. The default is batch. Batch contains only the m/z value and window size. Full also includes the data set comment string (if any), the file name, dimensions, interpolation option, abundance display option and normalization setting. |
BatchFigAxes | true | Include or exclude axis scales, labels and tick marks from exported batch figures. |
BatchFigAxesLabels | false | Include or exclude axis labels from exported batch figures. |
BatchColorbarStyle | compact | Style of the colorbar for batch processing figures: one of compact, fixed, exponent, general, auto or none. Compact is the default. |
BatchColorbarLabels | 6 | Number of labels on the colorbar of batch figures. |
BatchColorbarPrecision | 2 | Number of digits to the right of the decimal point displayed for batch figure colorbar abundance labels. |
BatchFontName | Arial | Font name for text in batch figures. Any installed font can be specified. |
BatchFontSize | 12 | Font size for text in batch figures. |
ExportToMATBatch | false | Save a MATLAB MAT file containing Xdata, Ydata and Zdata for each figure generated during batch processing. |
ExportToFIGBatch | false | Save a MATLAB FIG file for batch heatmap figures in addition to the graphics format file. |
ExportDuplicateMZBatch | false | If a peak list contains duplicate m/z values, generate duplicate figures during batch processing. A sequence number is appended to each file name. |
BatchPeakHeatmapUpdate | false | Controls updating of the heatmap plot during batch processing of a file of peaks. Not updating the main MSiReader heatmap as each m/z value is processed improves performance. |
BatchPeakHeatmapVisible | false | Set to true to make figures visible while batch processing. This will significantly increase the amount of time required to make a folder of images. |
Numeric precision for displayed items | ||
mzExportPrecision | 4 | Number of digits to the right of the decimal point in m/z values for exported plot titles and file names produced with the batch processing feature. Internal file contents are not affected. |
mzDisplayPrecision | 4 | Number of digits to the right of the decimal point for m/z values displayed in value and edit boxes. |
mzDeltaPrecision | 4 | Number of digits to the right of the decimal point for delta m/z values (e.g., m/z Step) displayed in value and edit boxes. |
AbundancePrecision | 3 | Number of digits to the right of the decimal point for abundance values (e.g., Scale Override) displayed in value and edit boxes. |
ConcentrationPrecision | 4 | Number of digits to the right of the decimal point for solution concentrations displayed in value and edit boxes. |
SpatialPrecision | 3 | Number of digits to the right of the decimal point for spatial dimensions displayed in value and edit boxes. |
Abundance Labeling | ||
RawAbundanceLabel | Ions/sec | Label to use on plots for raw abundance values. |
IonAbundanceLabel | Ions | Label to use on plots when abundance is scaled by injection time. |
NormSuffixLabels | 'Peak normalization' 'TIC normalization' 'Local TIC normalization' 'Max normalization' 'Mean normalization' 'Sum normalization' 'Median normalization' 'Midpoint normalization' 'Custom normalization' | Character string labels for the nine normalization selections: none, Ref peak, TIC, Max, Mean, Median, Midpoint, and Custom. The labels must all be on one line in the INI file. Any label containing whitespace characters (space, comma or tab) must be enclosed in single quotes. The default values are ‘’ ‘Peak normalization’ ‘TIC normalization’ ‘Max normalization’ ‘Mean normalization’ ‘Median normalization’ ‘Midpoint normalization’ ‘Custom normalization’ |
Binned data export options | ||
mzExportBinUnits | ppm | Bin size units for exporting data. Set to ppm or Th. |
mzExportBinWidth | 10 | The m/z width of the export bins. |
mzExportBinThreshold | 100 | Minimum abundance value included in a bin. |
mzExportBinFill | 0 | Value used to fill empty bins. Any character string including the not-a-number placeholder NaN is allowed. |
mzExportBinOption | 1 | Method used to compute the bin value: 1=mean, 2=sum, 3=max of all abundance values within the bin window. |
mzExportBinPlot | 0 | Optional plotting while computing bins. 0=none, 1=one plot updated in real-time, 2=a separate plot for each bin. Be careful with option 2, too many figure windows may be created! |
MSiColocalization | ||
ImageDimensionMaxRatio | 80 | Maximum ratio of the smallest to largest image in either dimension allowed for colocalizing saved image files. The value is expressed as a percentage. See §7.6.3. |
ColocalNormOption | data max | Normalization method used by MSiColocalization. |
MSiSlicer | ||
SliceLinePlotStyle | stem | Default type of 2D slice abundance plot in MSiSlicer. One of stem, stairs or line. The default is stem. See §7.4.6. |
SlicerExportPlotStyle | stem3 | Type of 3D plot exported from the MSiSlicer tool. Either stem3 or surface. The default is stem3. |
Polarity switching | ||
PolaritySwitchPattern | +--+ | Default polarity switching pattern. Possible values are +--+, -++-, +- and -+. |
PolaritySwitchMode | odd | Default polarity switching mode. Specify odd or even. |
MSiQuantification | ||
QuantifyMinSpots | 3 | Minimum number of spots to enable regression in the MSiQuantification tool. The minimum value is 3 and the max is 10. See §7.7.2. |
QuantifyDensity | 1 | Default MSiQuantification tissue density (g/cm3). |
QuantifyThickness | 10 | Default MSiQuantification tissue thickness (µm). |
QuantifyCalibrationMZ | 251.04739 | Default MSiQuantification calibration ion m/z value. |
QuantifyLiquidVolume | 0.1 | Default volume of MSiQuantification calibration spots (µL). |
QuantifyResponseTreatment | Abundance mean | Default treatment of response abundances for the MSiQuantification tool. One of Abundance mean, Abundance sum, or Abundance max. |
QuantifyRiskFactor | 0.05 | MSiQuantification risk factor = 1 – confidence level. Any value between 0.68 and 0.001 is acceptable. |
QuantifyPlotSpotLabels | true | Add spot labels on MSiQuantification regression plots. |
MSiCorrelation | ||
CorrelateEmptyImages | false | Enables the correlation of empty images. The abundance is zero for all scans for a candidate m/z value. See §7.6.5. |
AllowBinaryReferenceImage | true | Enables the optional treatment of a reference image ROI as all ones or all zeros. |
CorrelationScoresToSave | 110 | Number of correlation scores to save. Any positive value including 0, none, All and Inf. |
CorrelationImagesToSave | 100 | Number of top ranked images to save. Any positive value including 0, none, All and Inf. |
CorrelationAbundanceThreshold | 0 | Abundance threshold used by MSiCorrelation. A candidate image is considered empty if all scan abundances are below this value or they are all equal to zero. |
CorrelationReference | none | The default correlation method. One of none, Reference m/z, and External data. |
CorrelationMetric | Structural Similarity Index | The default algorithm selection for image correlation. One of Absolute Difference, Mean Squared Error, or Structural Similarity Index. The abbreviations AbsDiff, MSE, and SSIM are recognized. |
InvertReferenceImage | false | The default state of the Invert reference checkbox for MSiCorrelation. |
NormalizeExternalRefData | true | The default state of the Normalize external reference data context menu item for MSiCorrelation. |
MSIPCA | ||
MassRangeSelectionThreshold | 25 | Threshold number of mass channels for switching from a list selection dialog to a range selection dialog. Any value greater than 2 can be entered. |
External Calibration | ||
ExternalMasses | 371.1012 391.28428 413.26623 | Rank ordered m/z values for performing mass correction of a dataset. These values can be changed when the tool is launched. |
ExternalMassWindow | 30 | Default mass tolerance to consider a calibrant peak as being correct; units are in ppm |
CommandWindowProgressLog | false | Print progress message for each scan in the Matlab command window. This value can be changed when the tool is launched. |
RealtimeMassWindowPlot | true | Plot the progress of calibration for each scan. This value can be changed when the tool is launched. |
Adduct Calculator | ||
AdductCalculatorFile | MSiAdducts.xlsx | |
AdductCalculatorWorksheet | Common Adducts | |
AdductCalculatorLegend | Legend | These are how the data are stored in different fields in the output file specified above. |
AdductCalculatorHeaderRow | 1 | |
AdductCalculatorFirstRow | 2 | |
AdductNameColumn | 1 | |
AdductModeColumn | 2 | |
AdductFormulaColumn | 3 | |
AdductChargeColumn | 4 | |
AdductMultiplierColumn | 5 | |
AdductDeltaMassColumn | 6 | |
AdductDefaultSelection | 0 | |
METASPACE (Annotation File Structure) | ||
MetaspaceHeaderRow | 3 | Row containing column heading character strings. |
MetaspaceFirstRow | 4 | The first row containing data values. |
MetaspaceMassSelectionColumns | 6 | Columns used to create the m/z pull-down menu. |
MetaspaceRankSelectionColumns | 4 5 6 7 8 9 10 11 | Columns used to create the Image Order pull-down menu. |
MetaspaceMassSelectionDefault | 6 | Default m/z selection. |
MetaspaceRankSelectionDefault | 6 | Default Image order selection. |
MetaspaceMoleFormColumn | 4 | Column containing molecular formulas. |
MetaspaceAdductColumn | 5 | Column containing adduct formulas. |
Hotspot Removal | ||
HotSpotRemoval | true | Default is to have Hotspot removal ON |
HotSpotPercentile | 99 | Default is set parameter to the 99th percentile |
Peak Browser | ||
PeakThresholdIncrements | 500 | Increment for raising and lowering the peak browser abundance threshold with the arrow keys. |
Sequential Paired Covariance | ||
SPCEnable | False | Default is that SPC tool is not enabled via checkbox on main GUI. |
SPCThreshold | 1 | Default threshold abundance to include in the calculation. |
SPCLogbase | 2.718281828459046 | Default scaling of abundance after SPC is applied. |
SPCFilter | product | Default is to take the product for SPC algorithm. Other choices are sum, median and midpoint. |
Miscellaneous | ||
OpenglOption | auto | OpenGL rendering method. One of auto, software, hardware or hardwarebasic. The default is auto. |
MaxExcelRows | 1048576 | Maximum number of rows in an Excel worksheet. This value can be decreased to limit the size of an exported .xlsx file, but it cannot be increased. |
MaxExcelCols | 16384 | Maximum number of columns in an Excel worksheet. This value can be decreased to limit the size of an exported .xlsx file, but it cannot be increased. |
MaxExcelCells | 1e7 | Maximum number of cells allowed in an exported Excel worksheet. |
XLSTemplateFilename | Data processing export template file name. The default file is MassExcessTemplate.xlsx. It is stored in the installation directory. | |
Pathname | Default path when selecting a file, C:\MSiReader\Application\Example File | |