There are a lot of options on the main GUI for Pro and BioPharma modes which will be described in this user manual. Below you will find general information on the pull-down menus, toolbar icons and what they do, and a detailed list of context menus embedded throughout the program.
A video tutorial on navigating the main GUI of MSiReader for Pro (MSI) can be found HERE.
A video tutorial on navigating the main GUI of MSiReader for BioPharma can be found HERE.
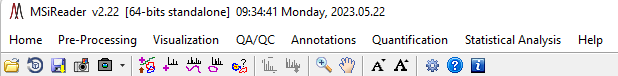
Figure 22: The top-level menu items and ICONS in MSiReader for both Pro and BioPharma modes (in BioPharma mode, Quantification is absent in the top menu). To access functions and tools under a given menu item, click on the menu item of interest and then again on the sub-menu. To view which license you have (Pro or BioPharma), click on Help and then About MSiReader.
The user-interface for MSiReader v3.12 has been completely re-designed to enhance the user-experience. The menu items and ICONS across the top are shown in Figure 22 with the different tools and functions that are available. When you first load MSiReader, the only functions allowed from the menu are load data and the information under the help menu. Once you load a file, the allowable functions will become active, which also depends on your license.
After opening MSiReader, you can adjust the size of the fonts for the user interface to match your display by simply clicking on the “A” ICONS in the taskbar (increase or decrease).
4.2 Toolbar Icons
There are a total of 19 toolbar icons that are provided to greatly enhance the user experience given that each is common to many different tools in MSiReader. Descriptions of each icon are provided below. You can also mouse over each icon when using MSiReader to get a tooltip of the functionality it provides. Icons are enabled and disabled as needed/allowable by the program.
 Load Data
The “load data” icon provides the same functionality as the drop-down menu under HOME “load data” or when clicking the “load data” button in the MSi Data/Plate Attributes pane. Prior to loading your data, make sure that you decide if you will do abundance thresholding, m/z filtering, want to load injection times, etc. – all of these choices must be set in the MSi Data/Plate Attributes pane prior to loading your file.

This “re-load” icon allows a user to have loaded a datafile(s) and carried out some operations. The user then decides that they want to re-load the current dataset forgetting any operations that have been carried out. Thus, this icon clears the data from memory including operations that have been carried out and re-loads the data.
 Save the current session (*.mss and *.mim formats). See §3.7.
This file format saves all selections you have made with the currently loaded dataset so when you return to MSiReader, you can simply load this file and continue your data analysis from precisely the same point.
 Save the Current Heatmap Image (file formats available from pull-down menu).
Click here to save the current heatmap to several different file formats (14 different formats are available). Once you click on this icon, it will display the figure and labels and then from there, using the toolbar in the new window, you can do the following: 1) save the figure; 2) print the figure; or 3) toggle to show heatmap with and without the colorbar – if you want to save the figure without the colorbar, do this first prior to saving.
 Export this figure to a .pdf or image file format.
 Restore a previously saved ROI.
 Select a single scan ROI using the cursor tool.
Click this icon to select a single pixel (or well) in the heatmap. The user can drag this around using the mouse. Once a selected pixel of interest is decided upon, the user can right click and a sub-menu comes up allowing one to export the coordinates, change the color of the cursor, or plot the mass spectrum for the collected (or filtered) m/z range. When viewing the mass spectrum, there are new icons in the toolbar at the top of the figure. These allow one to save the plot as a MATLAB .fig file, several different graphics file formats (e.g., *.png) or print the spectrum. The next band of icons in the toolbar allows you to select a peak in the mass spectrum and update the heatmap for that specific m/z. You can also copy details to the clipboard for the selected peak and enable the interactive peak browser.
 Select an ROI using the segmented line drawing tool.
Click this icon to select a line of any length or direction through the heatmap (well plate). Upon doing so, the length of the line will be shown on the top left of the heatmap. If you right click on the line in the image, you will be able to: 1) export the line ROI details; 2) set line color; 3) plot the ion abundance as a function of distance along the ROI line; and 4) select plot type (stem, stairs, or line).
 Select an ROI using the polygon drawing tool.
After an ROI is drawn the MSiExport, MSiSpectrum, and MSiQuantification tools are enabled as appropriate for each mode of MSiReader.
 Select interrogated and reference ROIs using the polygon tool.
After two ROI’s are drawn, the MSiPeakfinder and other tools are enabled.
 Export and view mass spectrum data for selected pixels.
Launches the MSiSpectrum tool.
 Launch the MSiExport tool for a ROI.
 Zoom in on the heatmap using the mouse clicks or the wheel.
To zoom in on a region within the displayed heatmap, click the zoom icon and then use mouse clicks or the mouse wheel and zoom in (out by moving mouse wheel in opposite direction) to more closely inspect a region of the image you are interested in.
 Pan the image with the mouse.
The user can pan over the heat map image to inspect different regions. This can be useful after zooming into the image.

Decrease or increase the font size to match your display characteristics.
Rather than use the OS display settings (which affect all your programs), we have added a feature to allow the user to increase or decrease the font size to match their display resolution and/or personal preference. This works for the main GUI put also the sub-GUI’s.
 Reload the MSiReaderPrefs.INI File.
Information about this function is detailed in §5 of this manual.
 Launch the default PDF viewer on your system and load the user manual.
Opens the comprehensive user manual complete with table of contents. The manual is divided into four sections: Part I: Getting Started; Part II: User Guide; Basic Functions; and Part III: User Guide: Advanced Functions; and Part IV: User Guide: BioPharma. Moreover, there are links to internal and external content embedded within the manual.
 Display information about MSiReader including copyright and license information.
This provides information regarding the copyrights owned by NC State University and MSI Software Solutions, LLC.
4.3 Context Menus
Several important features are accessed with right-click context menus on buttons, panels, checkboxes, dialog boxes and plots. These are available on the main GUI of MSiReader as well as for numerous tools in MSiReader. This was done as these menus apply to a specific tool or function that you are currently working with. An example is shown below; however, it is important that you right click on new tools that you are using to make the most efficient and effective use of MSiReader. These context menus will be highlighted in later sections. Since these context menus are self-explanatory, an exhaustive list with screenshots is not provided here. It is important to note that in previous versions of MSiReader, numerous functions were “hidden” in these context menus and difficult to find. We have moved all primary functions to the toolbar (menu items or icons) to avoid users having to “right click” to discover these functions and tools. What remains in the context menus allows users to be more productive while keeping the interface simple.
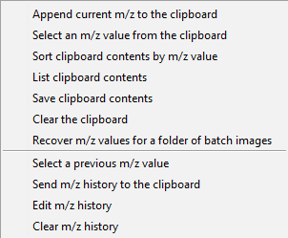
Figure 23: Context menu for clipboard and m/z history functions.
Figure 23 shows a screenshot of the MS Navigation pane after right clicking on the m/z field. This menu allows the user to use a variety of methods to re-load previously used m/z values, append new ones to the clipboard, clear the clipboard, etc. This context menu avoids the need to re-type accurate m/z values for analytes of interest. A detailed description of each menu item can be found in §6.2.3.
4.4 Resizing MSiReader Windows
The main MSiReader figure window and all sub-GUI windows are resizable. This allows MSiReader to be more effectively used with a variety of monitor resolutions, aspect ratios and dpi (dots-per-inch) settings. When started, the main window is sized to nearly fill the main screen of the computer. After startup, it can be made larger or smaller or moved to another monitor. For small, high-resolution screens, it may be necessary to adjust the dpi setting to greater than 100% text size. For WIN10/11 this is done from the display control panel. Changing the window size and the heatmap aspect ratio is also very useful if images from multiple data sets are stacked for simultaneous processing.